


 9 / 68

 A publication of
Winter issue 2016 sponsored by
CRE Finance World Winter 2016
7
The Case Against a Commercial Real Estate Bubble
Exhibit 2
Cap Rate Differences
These strikingly similar cap rates are why many in the market today
believe that another CRE bubble has formed. Only by analyzing the
forces behind these cap rates can we make the determination that
we are not in a bubble. In order to do this it is important to analyze
the differences between the constituent components of a cap rate,
the risk-free rate of return and the risk premium, from before the
recession versus the last few years.
The Risk-Free Rate of Return
As a general rule, the higher the risk-free rate of return, the higher
the cap rate should be, ceteris paribus. This is because any
investment needs to compensate the investor for the risk they are
taking (the risk premium) plus the risk-free rate of return that they
would otherwise receive from investing in a riskless asset. Due
to the relatively long-term holding periods for CRE, the ten-year
Treasury rate is often used as the risk-free rate of return. Once again,
it is instructive to look at differences, in this case the ten-year
Treasury rate from the years before the Great Recession versus
the last three calendar years. As you can see in Exhibit 3, there are
some significant differences between rates during these periods.
These equate to about 2% for each of the first two calendar-year
comparisons and not quite 1% for the last comparison. However,
this last difference is a bit misleading. The ten-year Treasury rate
fell dramatically during the flight to quality after the implosion of
Lehman Brothers. Prior to that, the difference was closer to the
2% that we see for the other years.
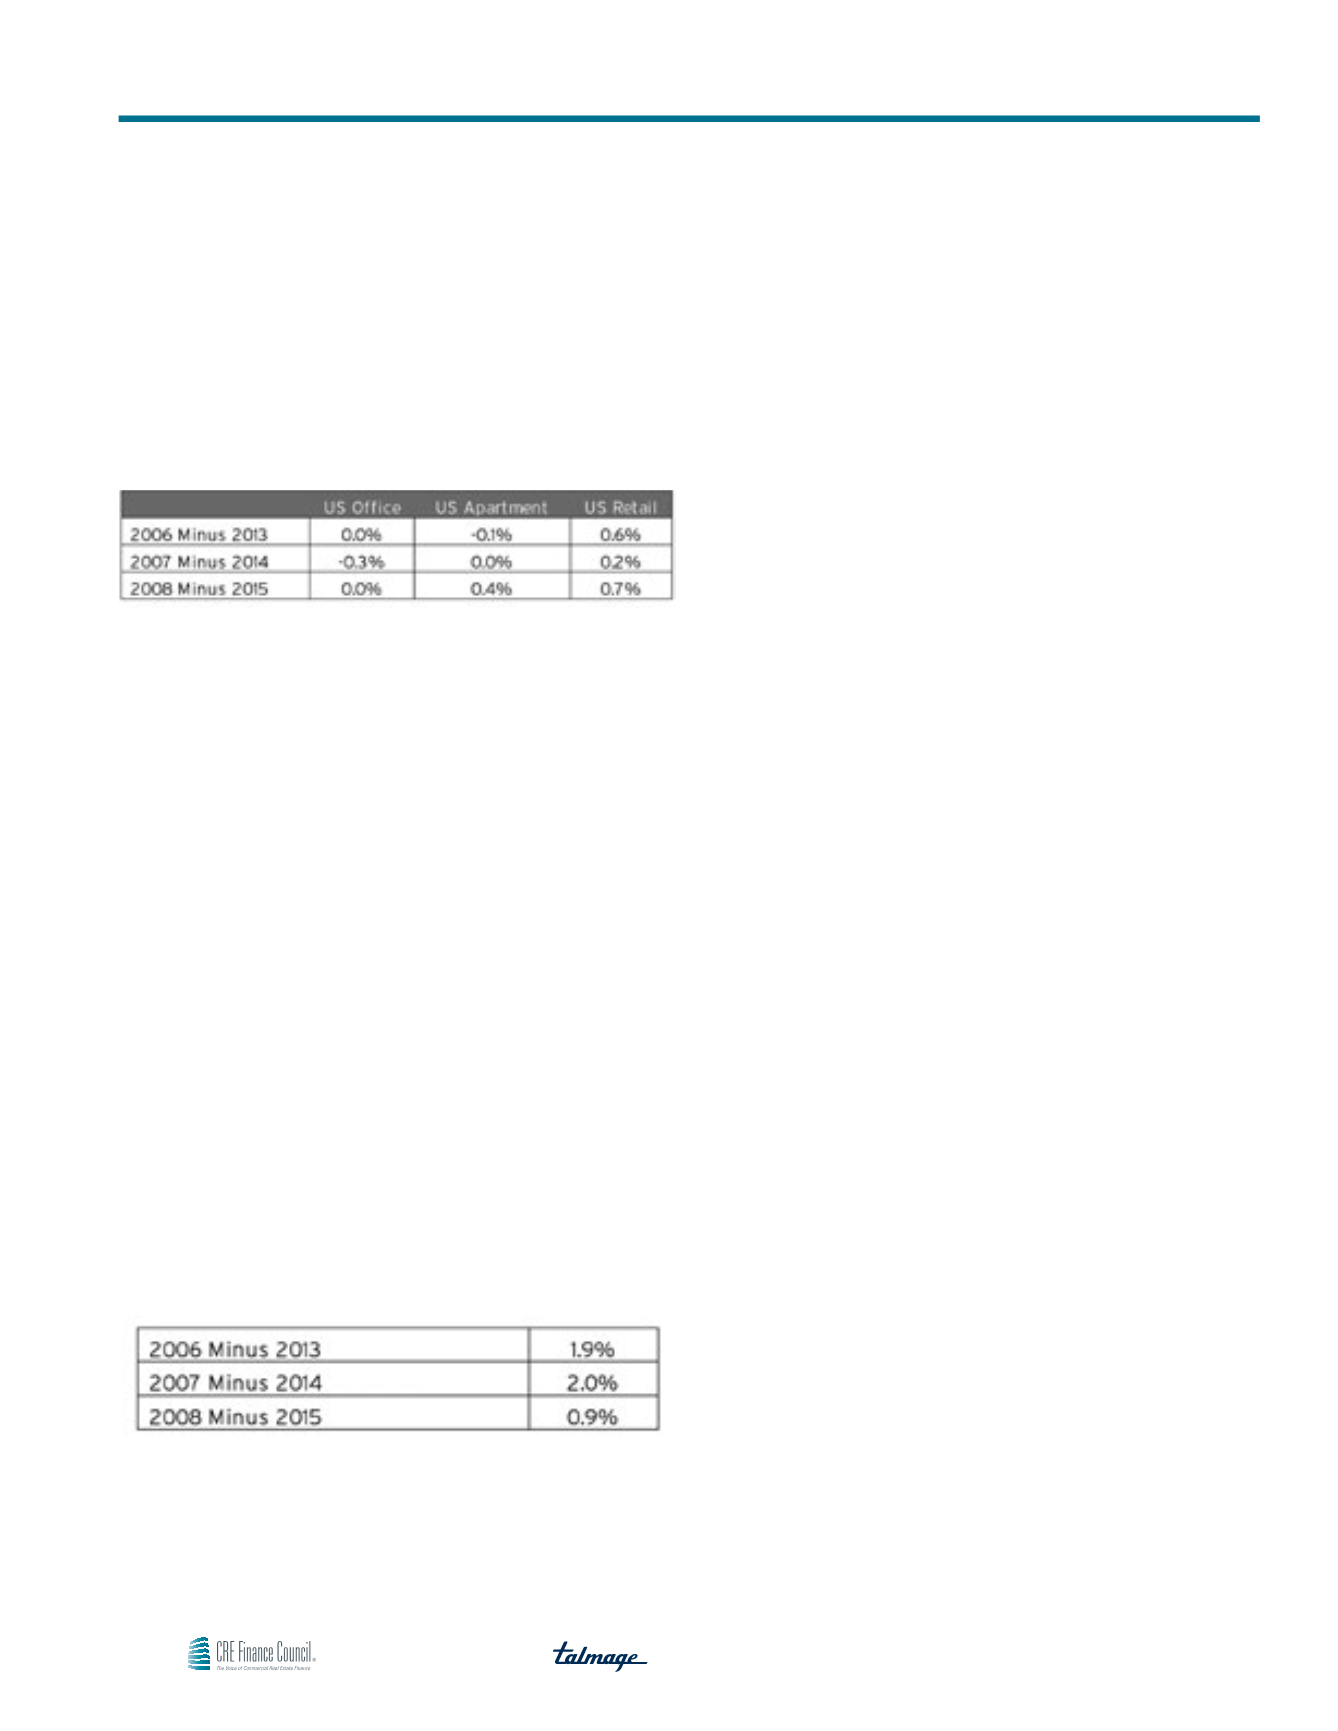
Exhibit 3
Ten-Year Treasury Differences
Ceteris paribus, the data demonstrates that based on the interest
rate difference, cap rates over the last few years should be lower
than cap rates from the years leading up the bubble bursting by
roughly 200 basis points. This therefore makes the environment
from before the Great Recession look like a bubble — cap rates were
too low relative to interest rates. However, in today’s environment,
cap rates are as low as they were before the recession, but that
seems appropriate in the context of ten-year Treasury rates being
roughly 200 basis points lower today than they were during the
bubble period. The instinct here is to conclude that a bubble also
exists today because the Fed is keeping nominal interest rates
artificially low, depressing cap rates, increasing market values
relative to intrinsic values, and creating a bubble.
However, the Fed can only affect interest rates in a limited way and
on a short-term basis. Of course the Fed sets the target Fed Funds
rate, which can be viewed as the benchmark for all other interest
rates. And the Fed’s policies influence (though do not explicitly
control) the rate of inflation, which partially determines nominal
interest rates. But the more critical component is real interest
rates, and the ability of the Fed to influence real interest rates,
especially over the long term, is limited because real interest rates
are primarily determined by the real growth rate of the economy.
Taken together, these two factors perfectly explain the low interest
rate environment of today. Inflation has been declining for a number
of decades as part of a longer-term structural change. However,
since the end of the recession it has been struggling to even reach
the Fed’s 2% target rate. Meanwhile, the real annual growth of the
economy since it began to recover in mid-2009 has been around
2%, below the economy’s long-run average and below the growth
rates achieved last decade before the bubble burst. Therefore, low
interest rates are not due to aggressive monetary policy, but are a
product of today’s slow-growth, low-inflation environment.
The Risk Premium
The risk premium is the other determinant of cap rates. The risk
premium generally derives from two sources — the fundamental
space market and the capital market. The key factor for space
market fundamentals is growth expectations. They are an important
determinant of cap rates because, ceteris paribus, investors generally
pay more for a property with rising cash flows than for one with a
flat or declining cash flows. Therefore, the greater the expectation
of cash flow growth, the greater the downward pressure on cap
rates. By looking at the trends in cash flow growth over time
between the two comparison periods (2006-2009 vs. 2013-2015),