


 14 / 68

CRE Finance World Winter 2016
12
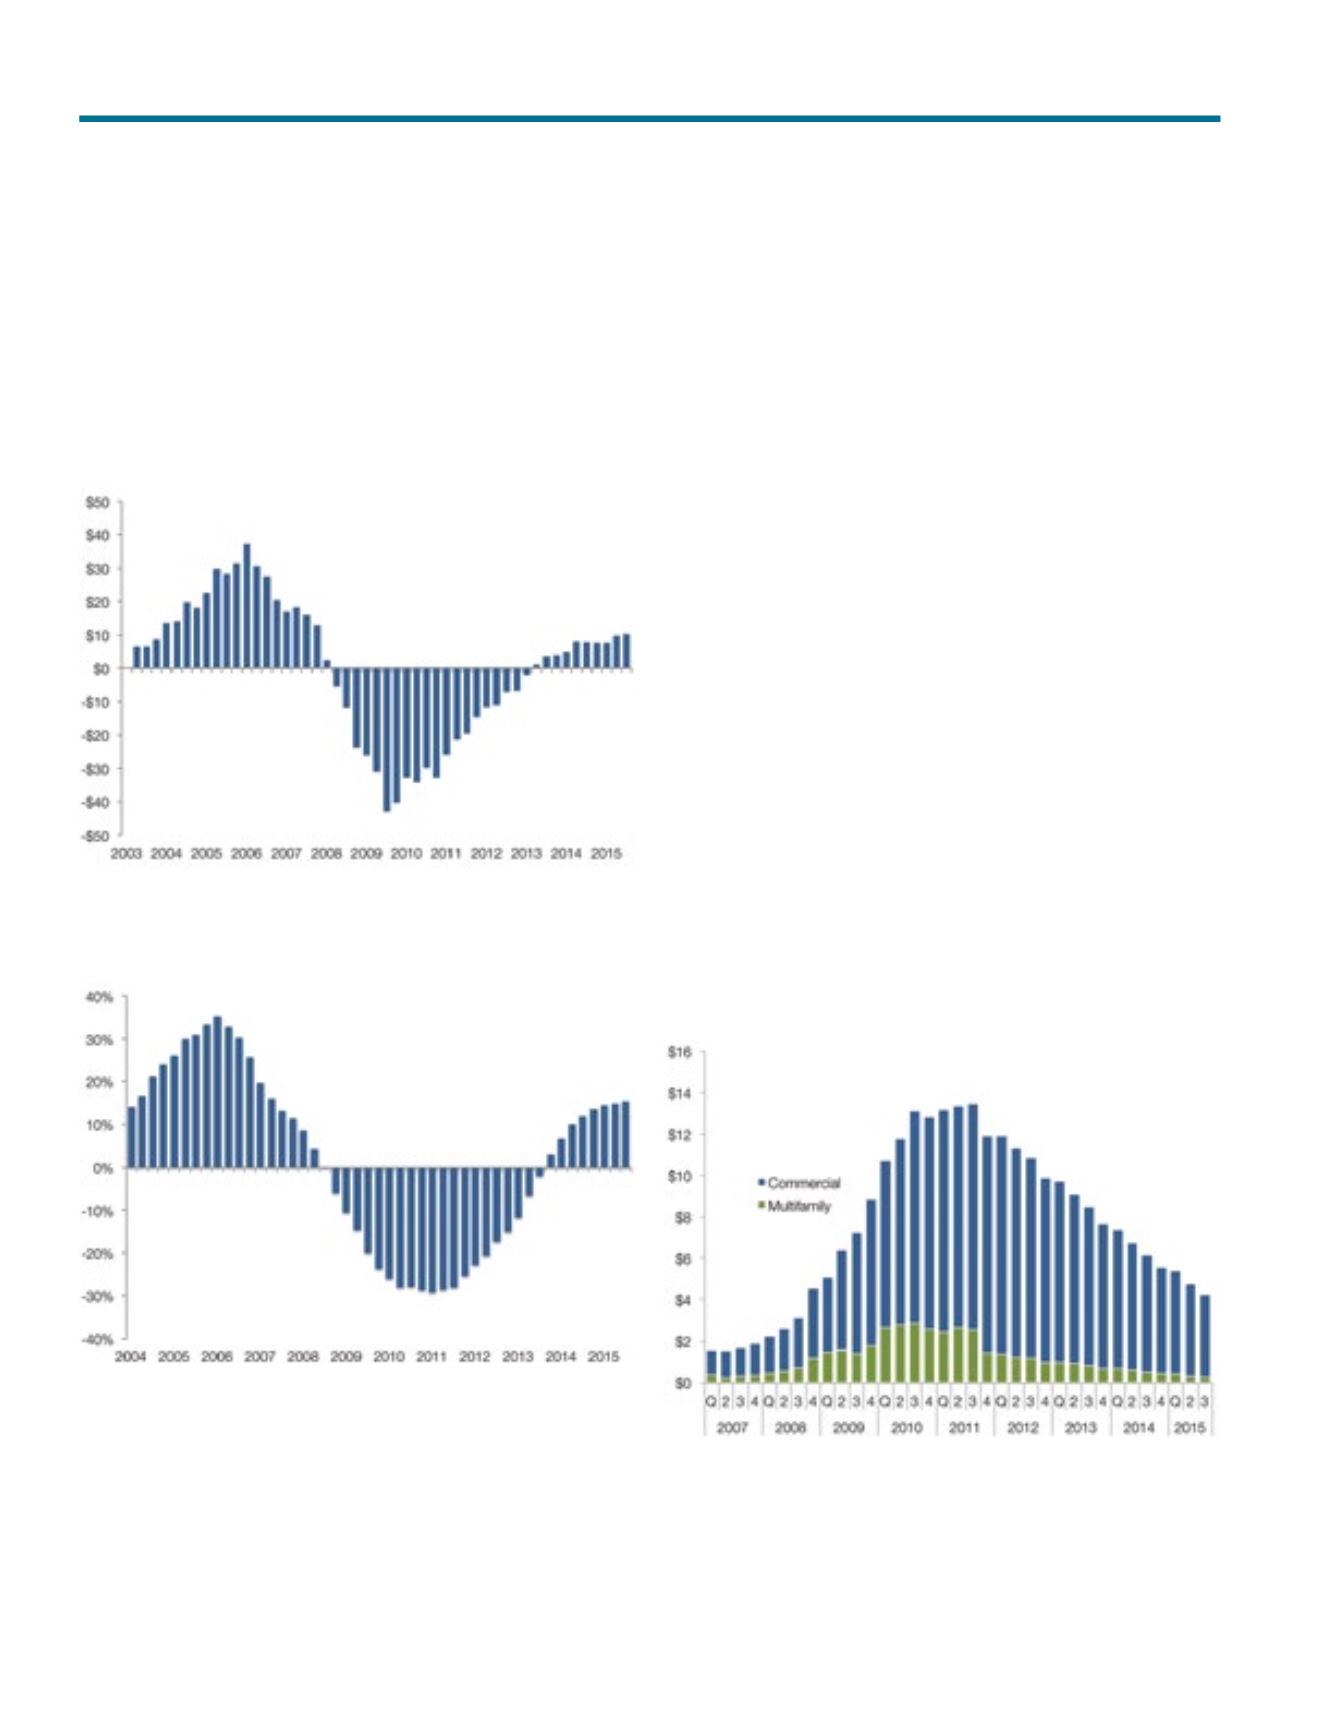
Chart 5
Quarterly Change in Construction Loans Held on Bank Balance Sheets
Source: FDIC, Call Reports, Chandan
In Billions
Chart 6
YoY Percent Change in Construction Loans Held on Bank Balance Sheets
Source: FDIC, Call Reports, Chandan
In Billions
While the pace of construction lending is increasing, it continues
to lag historical recoveries. Banks’ total construction exposure was
$266.1 billion in the third quarter, still a far cry from the 2008 peak
of $626.5 billion. In the years after the dot-com recession, growth
in year-over-year construction lending peaked at well above 30%.
Reflecting an ambiguous balance of regulatory pressures and lim-
ited need for additional inventory, construction lending is growing
at half its former record-setting pace. There are exceptions, most
notably New York City’s office building boom, but smaller banks
play a limited role in this segment of the market.
Bank Real Estate Owned and Restructuring
Distress investors with capital to deploy will do better with pending
CMBS maturities, where persistent concerns about pending legacy
maturities are a direct rather than indirect driver of the analysis. As
of the third quarter, commercial and multifamily other real estate-
owned (REO) had fallen to $4.2 billion, roughly one quarter of its
peak level in 2010. Whether through write-downs or modifications
or improvements in market conditions, the bulk of moderate quality
and high quality properties have found their way out of distress.
Exceptionally high recovery rates on early REO sales reflect that
better quality investments were jettisoned early by banks. Little of
what now remains holds institutional appeal.
Chart 7
Bank Commercial and Multifamily Real Estate Owned (REO)
Source: FDIC, Bank Call Reports, Chandan
In Billions
Continued Slow Growth in Bank Construction Lending