


 8 / 68

CRE Finance World Winter 2016
6
A
The Case Against a Commercial
Real Estate Bubble
Shan Ahmed
Analyst
Reis, Inc.
Michael Steinberg
Associate
Reis, Inc.
Ryan Severino
Senior Economist and
Director of Research
Reis, Inc.
financial bubble is generally defined as trading in an asset
market at a price or price range that significantly deviates
from the corresponding asset market’s intrinsic value.
It could also be described as a situation in which asset
prices appear to be based on improbable, aspirational, or
inconsistent views about the future. Bubbles are insidious things.
They are incredibly difficult to spot in advance because it is often
difficult to determine intrinsic value on a real-time basis. Therefore,
it is almost always only after the fact of a bubble bursting that it
becomes apparent that one even existed. Even as the commercial
real estate (CRE) market stared into the face of one in 2008, there
were many who ardently denied the bubble’s existence.
The only good thing about bubbles (if there is any such good thing)
is that they provide useful guides to determine if a market has
entered another bubble. Therefore, by using the most recent CRE
bubble as a benchmark, the current market environment can be
analyzed to determine if another bubble has formed, or is potentially
forming. When this analysis is performed, it is apparent that the
current situation is not representative of a bubble.
What Qualifies as a Bubble?
In CRE what qualifies as a bubble? What should be used to determine
if intrinsic value is misaligned with current values? Comparing a
pure valuation metric such as price per square foot or price per
unit can be misleading since values tend to rise over time, if for no
other reason than inflation. Therefore, ceteris paribus, one should
expect real estate values to trend upward over time. Empirically,
that is generally observed. However, we can compare cap rates,
which are defined as the ratio of net operating income (NOI) to
value, because both NOI and values tend to rise over time due
to the systematic impact of inflation on both, providing a better
assessment of value. Moreover, cap rates are frequently the key
pricing metric that investors use to determine the intrinsic value
of a property. As a general rule, the lower the cap rate, the greater
the perception that market values have risen above intrinsic values
because of the inverse relationship between value and yield.
Therefore, this examination will compare the current cap rate
environment to that of the bubble years from before the recession to
determine if the market is currently experiencing another valuation
bubble. Specifically, it will look at the constituent components
of cap rates to help determine if intrinsic values are aligned with
current valuations.
Current Cap Rates Versus Bubble Cap Rates
The first step in this process is to compare the current cap rate
environment with the previous bubble’s cap rates across property
types. For this purpose, we employ cap rates from the three major
property types — apartment, office, and retail. We will compare cap
rates from 2006, 2007, and 2008 (when the CRE bubble finally
burst after the implosion of Lehman Brothers) with cap rates from
the last few years — 2013, 2014, and 2015. Therefore 2006 will be
compared to 2013, 2007 to 2014, and 2008 to 2015. These years
were chosen not only because we want to compare the current
environment to that during which the bubble burst, but also because
the recovery/expansion periods in the economy are of similar length
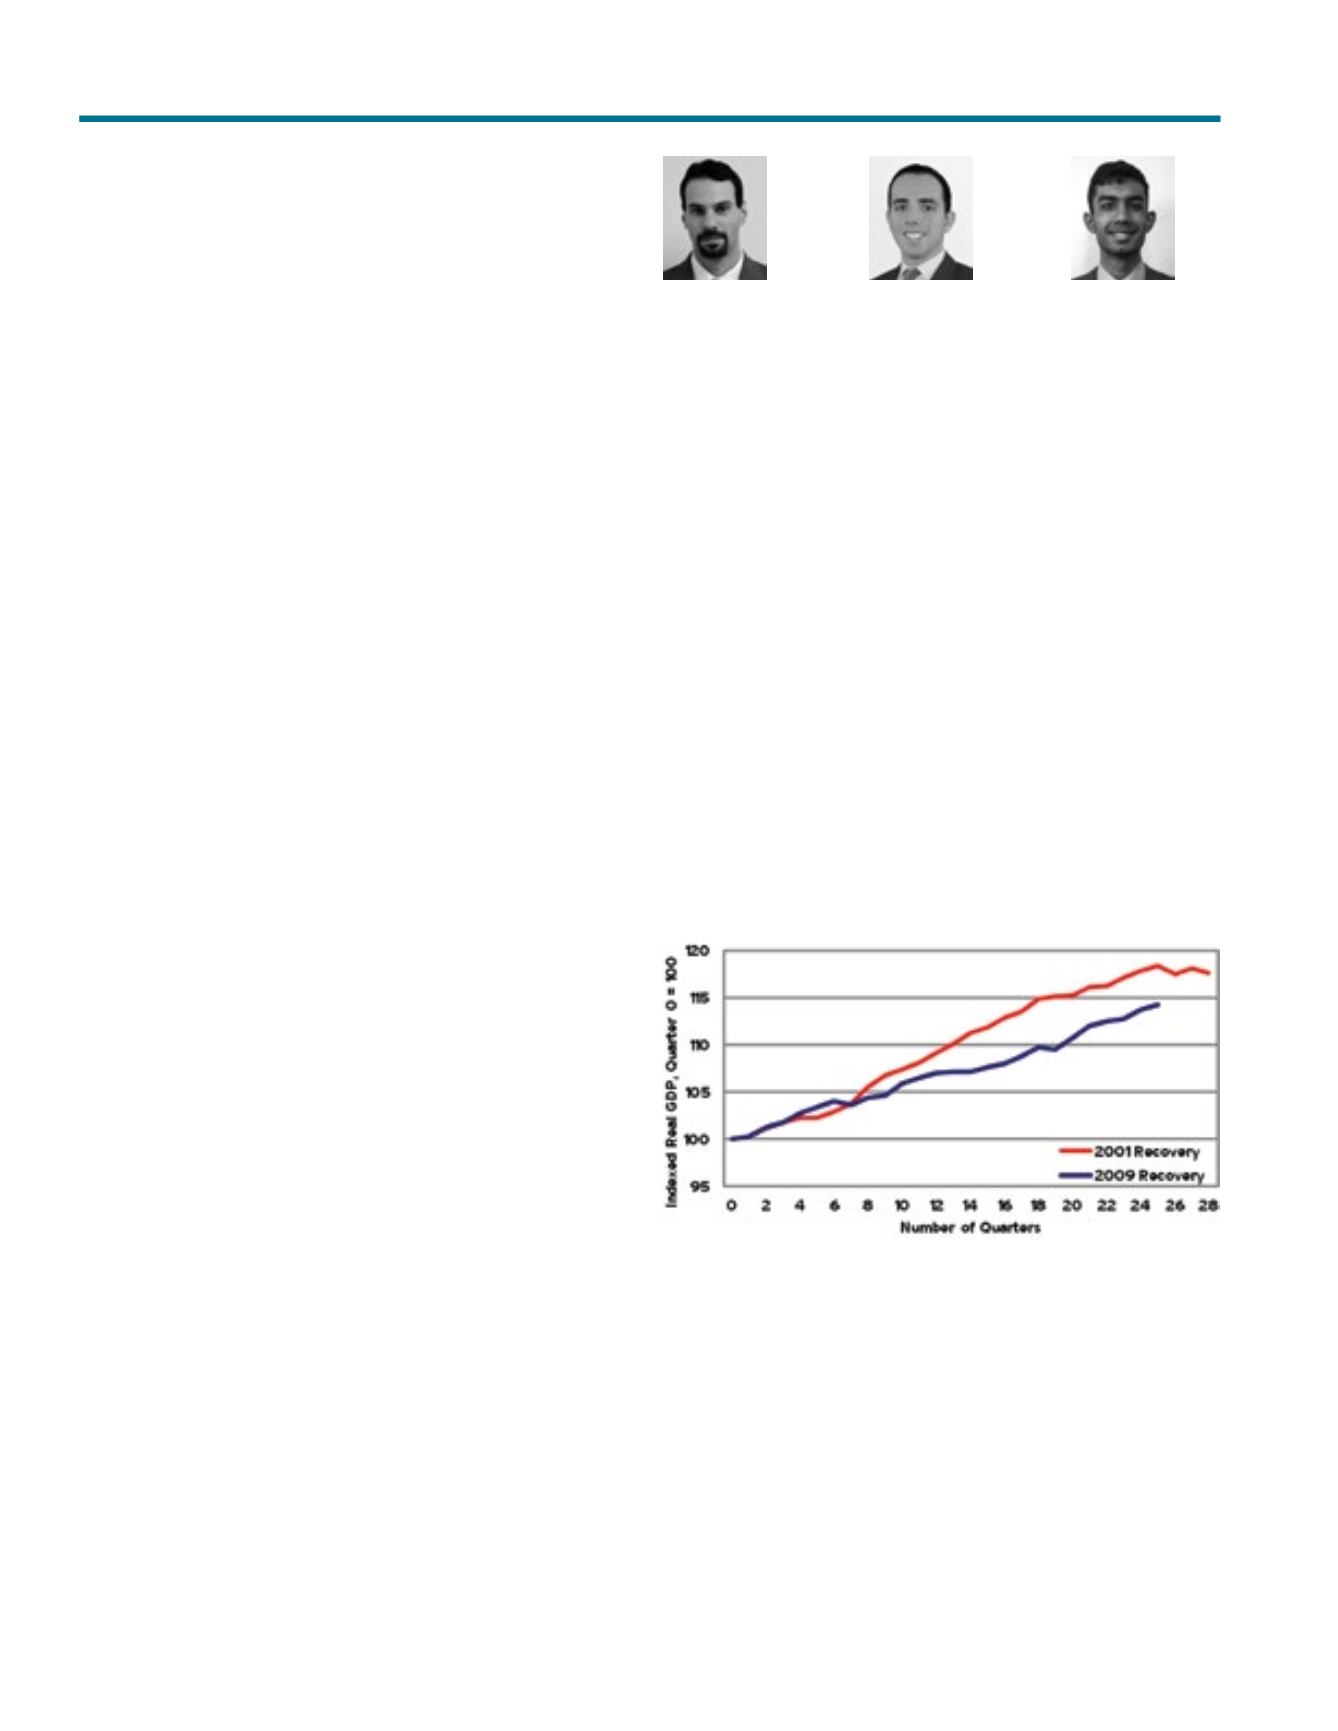
and make for an apt comparison. After the
dot.comrecession of
2001 ended, there were 28 quarters until the CRE bubble burst.
In contrast, there are 26 quarters between the end of the Great
Recession and the current quarter, the fourth quarter of 2015. This
comparison is shown in Exhibit 1. Because the fourth quarter has
not yet ended, there is no growth rate for real GDP yet.
Exhibit 1
Comparison of Two Recoveries
The aim is not to imply that a bubble is imminently about to burst,
but to contrast the environment leading up to the bursting of the
bubble from the last decade with the environment leading up to
today. We utilize 12-month rolling cap rates because 2015 has not
yet ended so the full calendar-year cap rate is not available. For
the other time periods the 12-month rolling cap rate is the average
cap rate for each calendar year. The simple differences between
calendar year cap rates show how remarkably similar today’s cap
rates are to cap rates from before the Great Recession. These are
shown in Exhibit 2.