


 13 / 68

 A publication of
Winter issue 2016 sponsored by
CRE Finance World Winter 2016
11
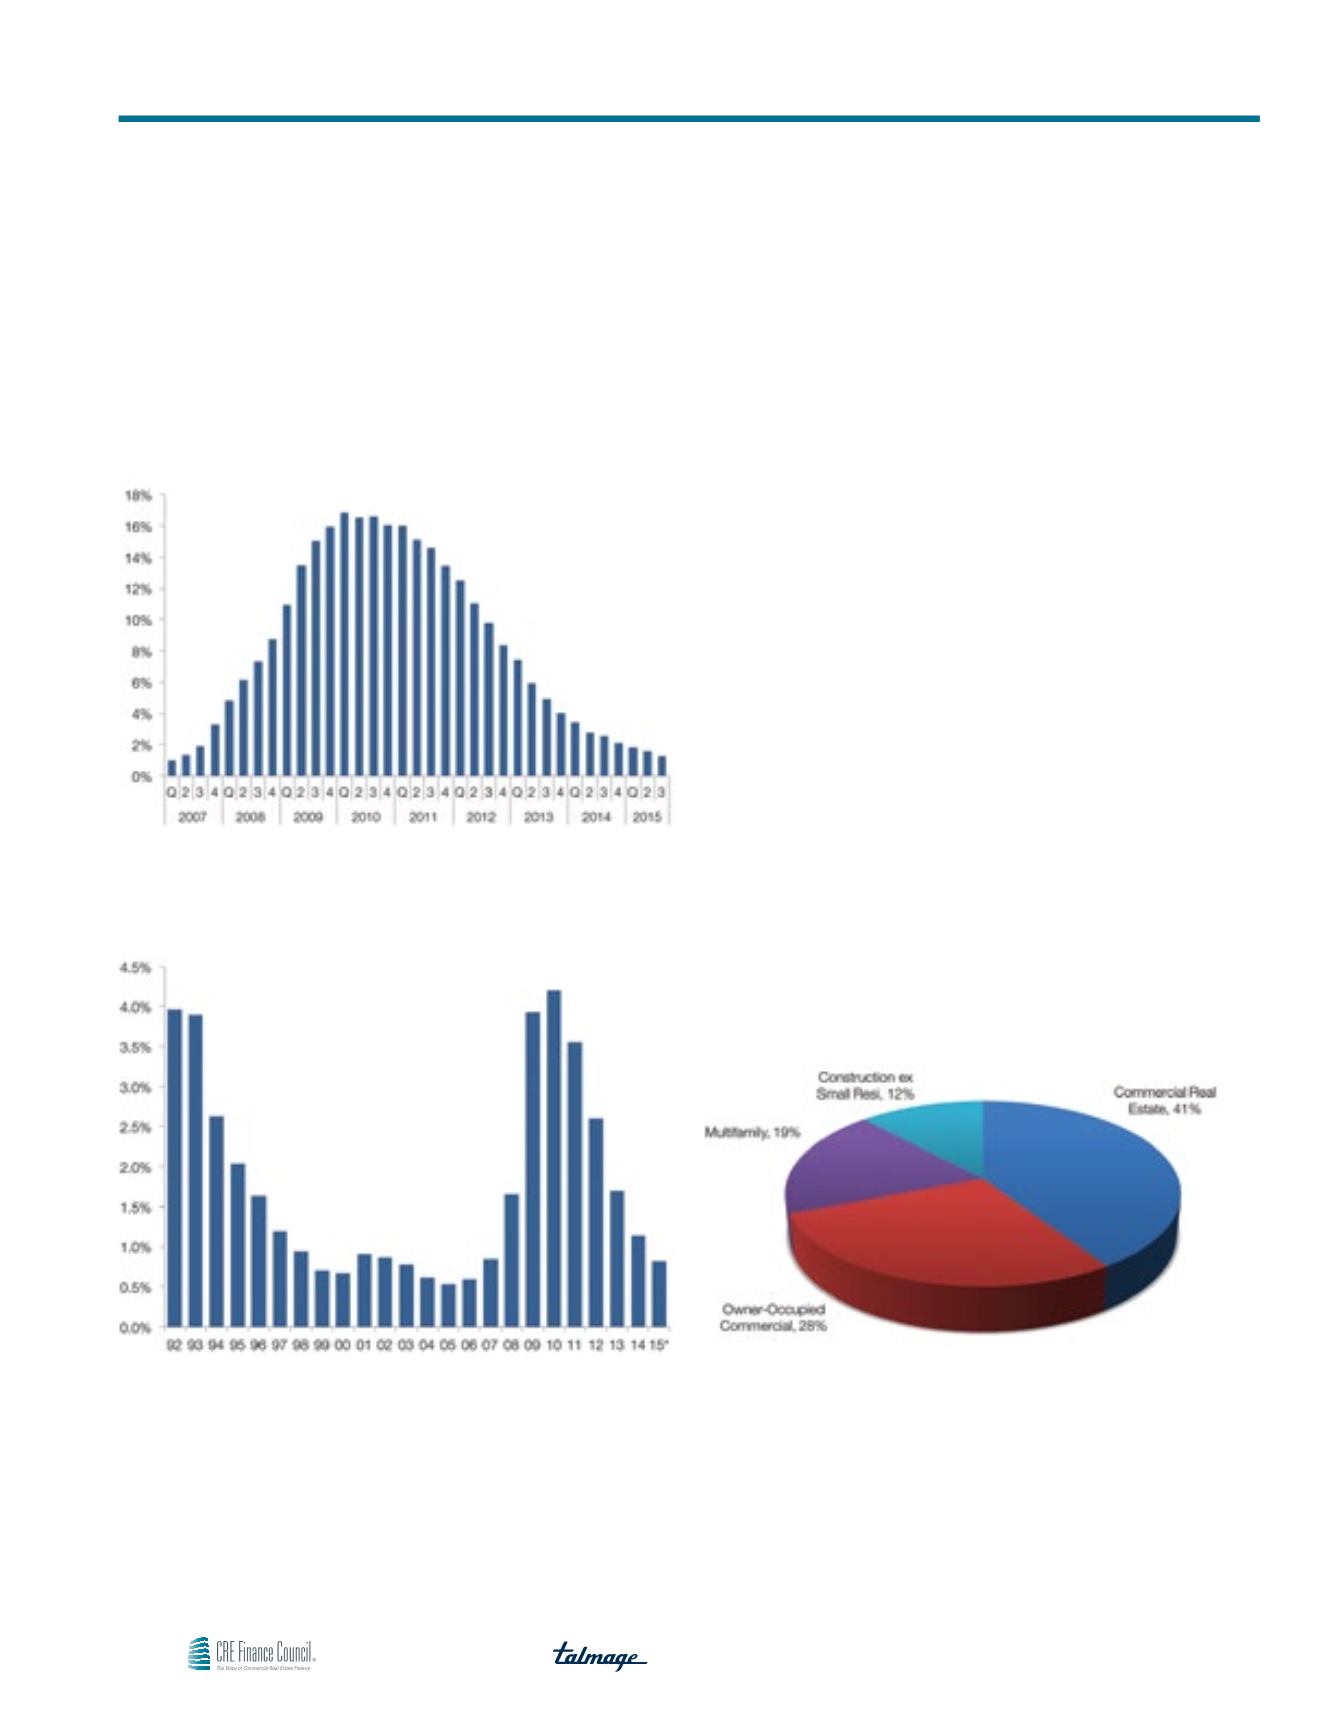
Chart 2
Default Rate for Bank Construction and Development Loans
Source: FDIC, Bank Call Reports, Chandan
Chart 3
Long-Term Default Rate Trends: End-of-Year Default Rate for
Commercial and Multifamily Mortgages Held by Banks
Source: FDIC, Bank Call Reports, Chandan
Note: 2015 through Q3
Bank New Lending Trends
Higher lending volumes have been an important contributor to lower
default rates, which reflect the near-complete dilution of legacy
pre-crisis bank loans as well as the cumulative impact of write-
downs and troubled debt restructurings. Exclusive of multifamily
lending, the balance of commercial mortgages held by banks
increased to $1.2 trillion in the third quarter of 2015, its highest
level on record. The $23.8 billion quarter-to-quarter increase was the
largest in seven years. Multifamily lending also posted its largest
quarterly net increase of the post-crisis era, rising $13.9 billion.
Across both commercial and multifamily mortgages, net lending
has increased by $106.4 billion from a year earlier, a 7.5% expansion
in banks’ exposure to the sector.
Bank Construction Financing
As of the third quarter, small residential properties accounted for
just under 22% of banks’ outstanding construction loans. Across
all projects, including multifamily and commercial real estate devel-
opment, net lending has increased for ten consecutive quarters, by
$64.6 billion over the two and half years since construction financ-
ing’s nadir. Loan-to-cost ratios have trended slightly higher but
understate the risk profile of banks’ exposure because of leverage
measured against rising construction costs.
Chart 4
Bank Exposure to Multifamily and Commercial Real Estate
As of Q3 2015
Source: FDIC, Call Reports, Chandan
Continued Slow Growth in Bank Construction Lending