


 10 / 68

CRE Finance World Winter 2016
8
it is obvious that the current environment differs greatly from the
pre-recession environment for each of the three major property
types. The annual cash flow growth rates by property type for the
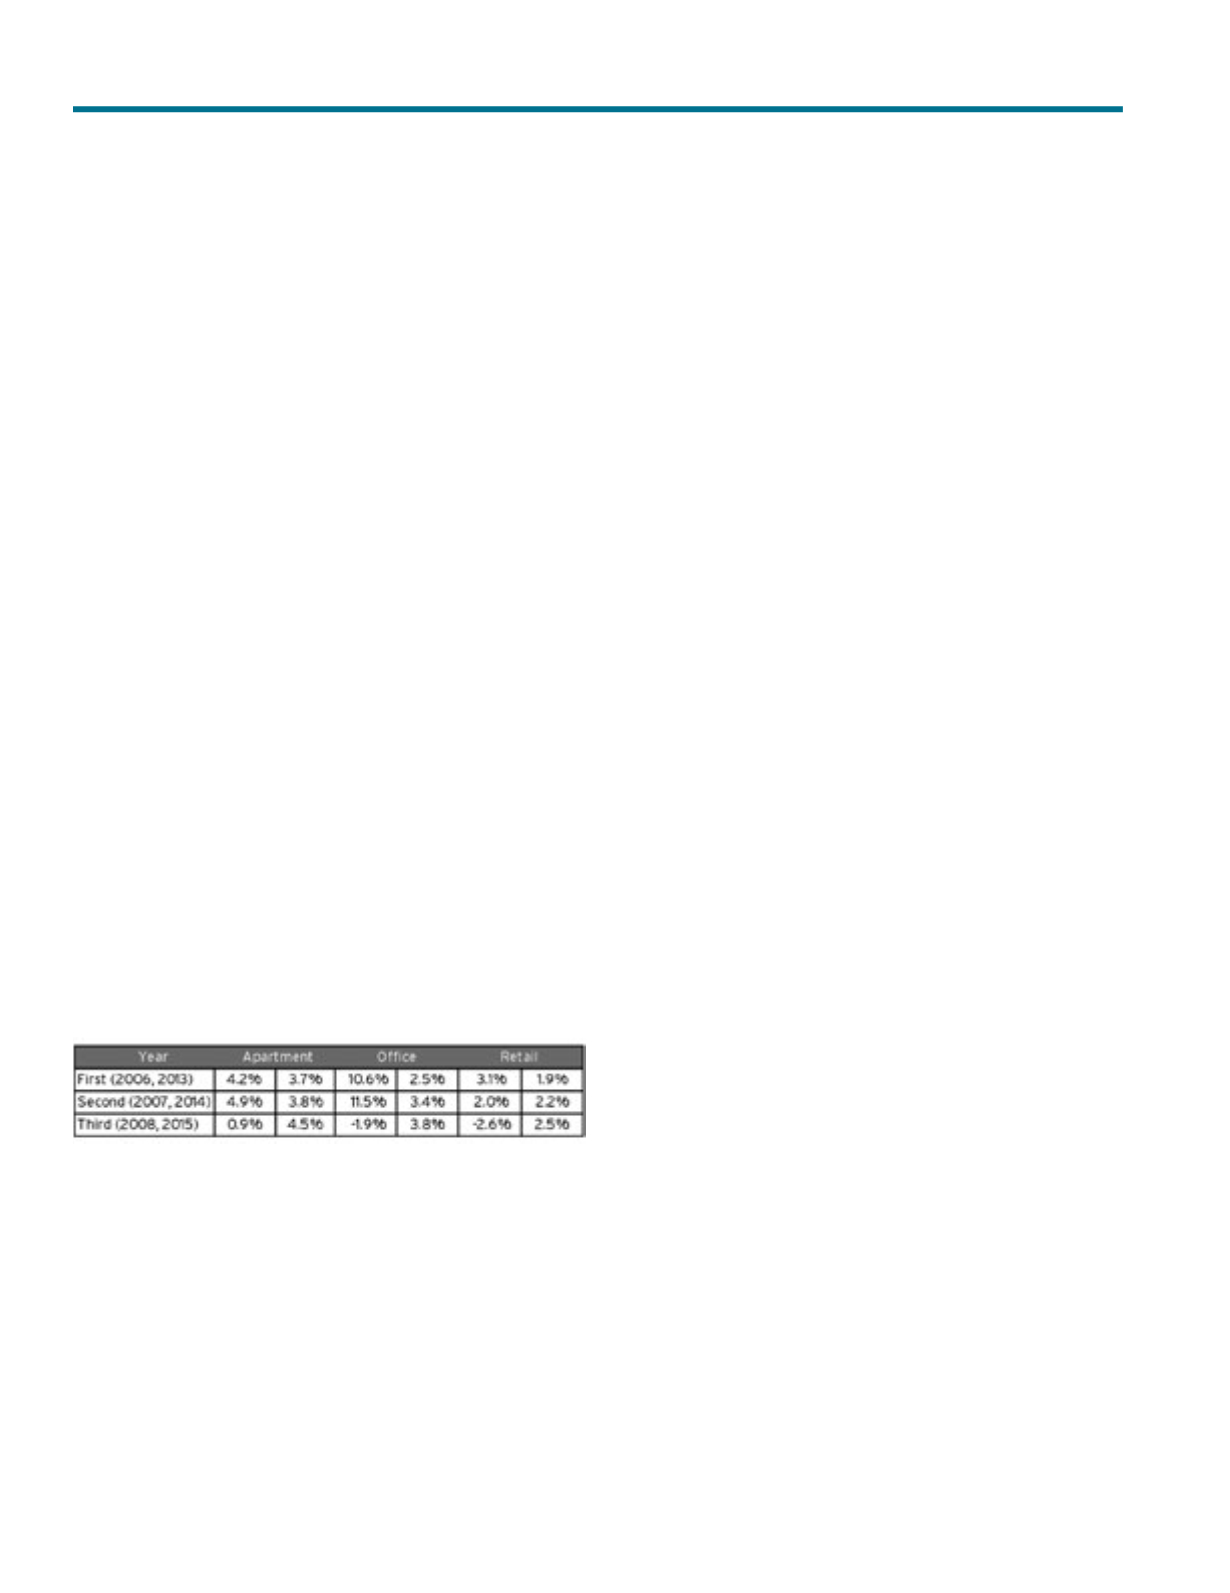
aforementioned periods are shown in Exhibit 4. Note for 2015,
because the year has not ended, the current forecasted cash flow
growth rates are utilized. However, with three quarters of the year
already completed, the actual growth rates for 2015 are unlikely to
deviate significantly from the forecasted figures.
For the period 2006-2008, growth rates had been accelerating
over time and reached robust levels by 2006 and 2007. The one
possible exception is with retail where massive overbuilding limited
cash flow growth. Problems with valuations arose in early 2008
when the cash flow growth rates began to slow, even before the
CRE bubble burst. Nonetheless, investors continued using highly
improbable forecasted growth rates (anchoring their expectations
to recent positive experience in 2006 and 2007) that were not
going to be ultimately realized. By the end of 2008, the actual growth
rates for office and retail were negative while that of apartment
was slightly positive. All of these growth rates came in well below
expected growth rates that were being used in valuations at the
time. These overly optimistic assumptions about future cash flow
growth caused a compression in the risk premium as investors
believed the strength in the market would continue, just as the
market was about to implode. Consequently, this helped push cap
rates to levels that were too low — market values spiked and deviated
significantly from intrinsic values.
Exhibit 4
Cash Flow Growth Rates by Period
However, for the 2013-2015 period, cash flow growth continues to
accelerate, has not yet peaked, and remains far below the growth
rates from the 2006-2007 period. Moreover, even if the forecasted
cash flow growth rates for 2016 and beyond increase, it is highly
unlikely that they will reach the growth rates from the 2006-2007
period. Although the current positive trends in cash flow growth
and current cash flow forecasts are putting upward pressure on
valuations and downward pressure on cap rates, they are not doing
so to the same extent as before the recession. Essentially, this
is the inverse of what was observed with interest rates. During
2006-2008, interest rates were generally high which put upward
pressure on cap rates. However, the overly optimistic assumptions
about cash flow growth during that period lowered the risk premium
and put downward pressure on cap rates. During the current
period, relatively low interest rates are putting downward pressure
on cap rates. However, because cash flow growth is not nearly
as strong now as it was before the recession, investors are using
more modest (or at least less aggressive) assumptions about
forecasted cash flow growth and consequently the risk premium.
Therefore, downward pressure on cap rates from projected cash
flows exists, but not nearly as much as it did before the recession.
This is causing market values today to be far closer to intrinsic
values than they were around the time the bubble burst.
Capital markets also have a profound impact on the risk premium,
but directly measuring this impact can be a challenge. For example,
the interest rate on commercial mortgage debt can be a poor
indicator because of the risk-free rate component — commercial
mortgage rates could be low simply because Treasury rates are
low, not because the risk premium is low. However, these impacts
can be measured indirectly by the level of CRE debt outstanding —
the more investors are willing to use debt, it intimates that they
prefer taking on risk and/or they perceive risk as being low. This
process results in a compression of the risk premium and consequently
cap rates. Because debt is stated in nominal terms, the absolute
level of outstanding debt is misleading because it will rise over time
as values rise. Moreover, using loan-to-value ratios can also be
misleading because inflated property values can mask excessive
risk taking because the denominator of the loan-to-value ratio
rises along with the numerator and can artificially underestimate
the level of debt and risk.
Therefore, we need to measure the level of debt relative to an
independent factor, like gross domestic product (GDP). Although
property values tend to be positively correlated with the overall
The Case Against a Commercial Real Estate Bubble