


 11 / 68

 A publication of
Winter issue 2016 sponsored by
CRE Finance World Winter 2016
9
economy, gross domestic product is a flow metric, not a valuation
metric, and because it encompasses the entire economy it is much
harder to manipulate or artificially inflate. Because debt outstanding
is stated in nominal terms, the nominal GDP must be utilized. In
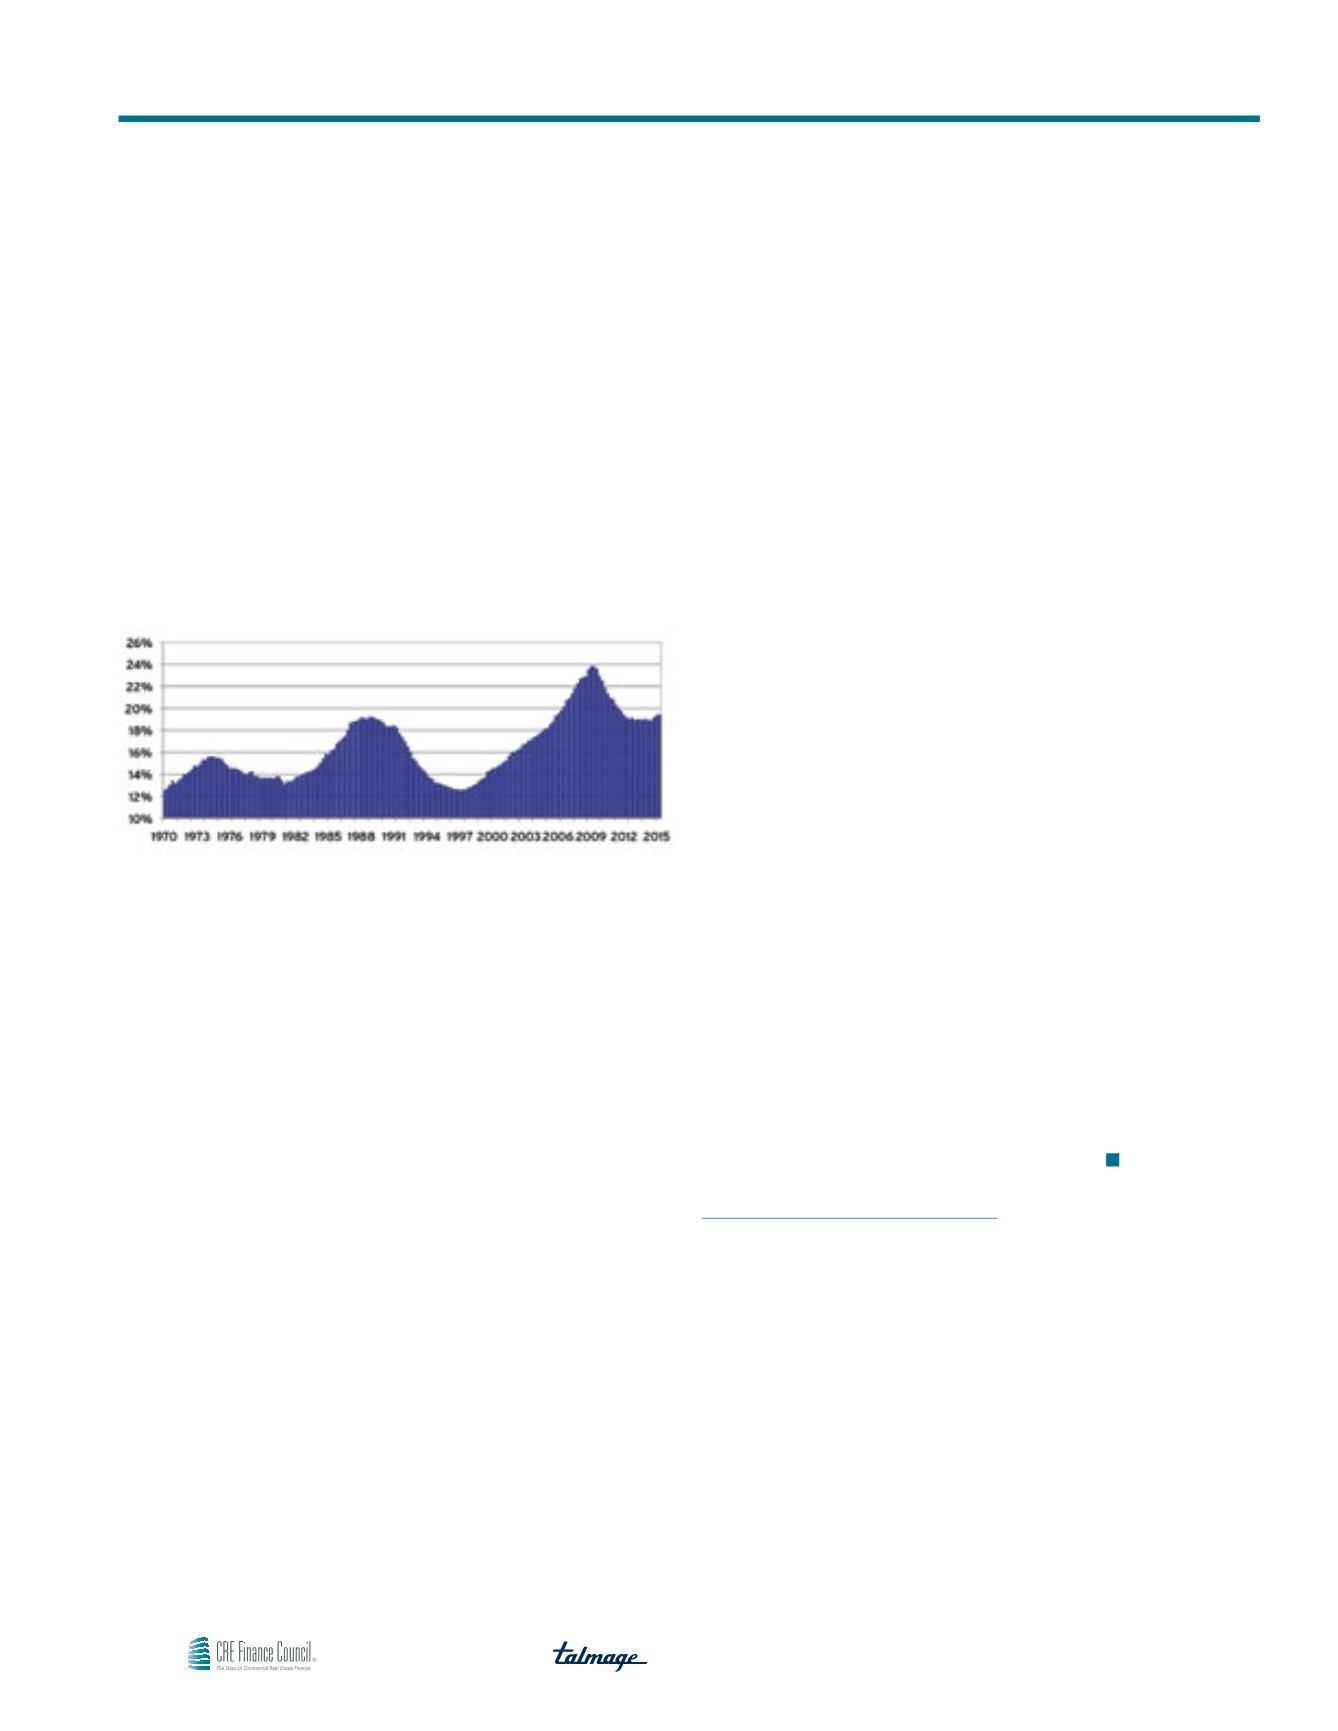
Exhibit 5, the ratio of total CRE debt to nominal GDP is calculated
over time.
Exhibit 5
At the height of the bubble in 2008, when the perception of risk
and the risk premium were excessively low, the ratio of total CRE
debt outstanding to nominal GDP was roughly 24%. This was the
historical peak of this ratio and was reflective of an environment
where the incorrect perceptions of risk pushed valuations up and
the risk premium down. However, as of the most recent quarter of
available data, this ratio has not even surpassed 20%. Therefore,
risk perceptions and the risk premium remain at relatively safe
levels. The 4% or so difference between the current and peak
ratios translates into roughly $720 billion of net new loan issuance,
based on the current nominal GDP. At a rate of $120 billion of net
new CRE debt per year, it would take six years to reach that 24%
level again, assuming no nominal GDP growth. If the economy
continues to grow as most expect, the ratio might only drift marginally
higher, much as it has over the last few years. Therefore, the current
ratio, which is roughly equivalent to the level from 2003 before
the bubble truly began to inflate, does not indicate excessive risk
taking, a mistakenly low perception of risk, or too low of a risk
premium. If anything, it reinforces the notion that the risk premium
prior to the downturn was far too low. Using the current market as
a guide, the risk premium from before the recession was probably
roughly 200 basis points below where it should have been. In this
context, today’s cap rates seem more or less appropriate while
those from before the downturn seem far too low, even though cap
rates from those two periods are incredibly similar.
Conclusion
There is ample evidence to indicate that the current market is not
a bubble. The ten-year Treasury rate, though low, is appropriate
as a function of the current economic environment, not monetary
policy. Cash flow growth, though positive, is low relative to the
period leading up to the recession and is not resulting in underwriting
that is incongruent with probable cash flow growth rates. Lastly,
debt is not being over-utilized as was the case during the pre-
recession period. Investors are generally far more realistic and
restrained during this phase of the cycle using a more appropriate
risk premium.
However, this does not eliminate the possibility that another bubble
could form in the future. As interest rates rise with the continuing
recovery in the economy, the risk premium should decline, keeping
cap rates in a relatively narrow range. However, if discipline begins
to erode and the risk premium compresses too much, it is not
too difficult to envision another environment where cap rates fall
further than they should and market values exceed intrinsic values.
We are not ruling out the distinct possibility of a severe shock
prompting an economic downturn, which might then lead to CRE
fundamentals deteriorating. However, even if such a scenario takes
place, careful analysis will need to be performed before ex post
blanket statements like “Oh, there must have been a CRE bubble”
are issued. Accepting the “bubble” explanation after a downturn
occurs without nuanced thought is sloppy logic.
The Case Against a Commercial Real Estate Bubble
Click Here to Share Comments on this Article