


 29 / 48

 A publication of
Autumn issue 2015 sponsored by
A publication of
Autumn issue 2015 sponsored by
CRE Finance World Autumn 2015
27
Many borrowers in the non-recourse space desire higher leverage
and absent any pricing dislocations we would expect the trend to
continue for the foreseeable future. We are hopeful, however, that
the rate of increase in HL loans will decelerate — as they already
constitute more than a third of recent conduit transactions.
It is important to note that KLTV is based on KNCF and KBRA
value, which reflect KBRA’s estimate of normalized sustainable
property performance, and are generally lower than third party
appraiser values by 35%, on average. Furthermore, some of the
higher leverage loans may be on higher quality assets in major
metropolitan areas, where conduit lenders are more likely to
compete with insurance companies and balance sheet lenders.
The location of these properties, coupled with their quality and,
at times, the presence of IG credit tenancy, somewhat mitigates
their higher leverage.
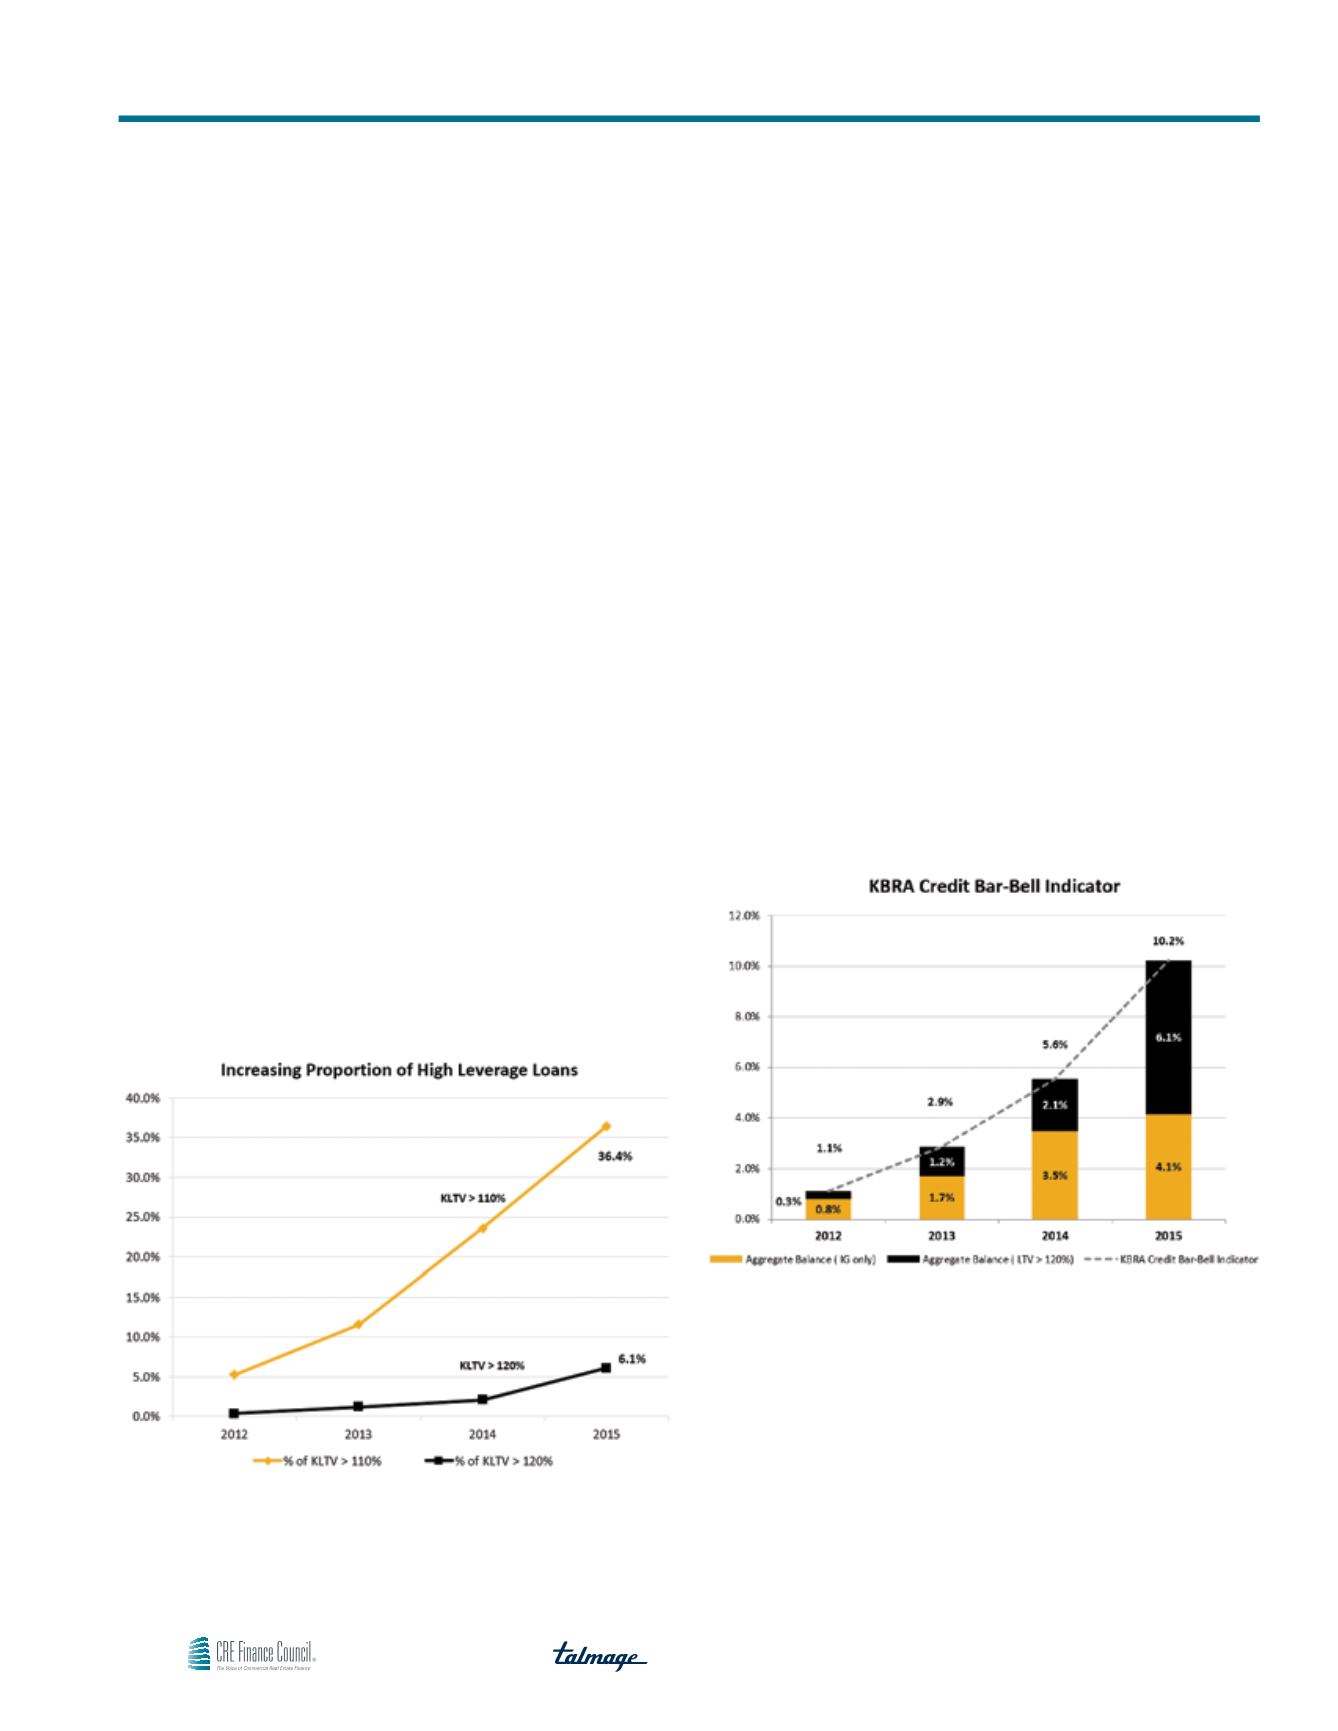
While this is the case, the growing number of HL loans is still viewed
unfavorably — particularly those with ultra-high leverage. As per
the graph, the proportion of these loans, which have KLTVs in
excess of 120%, has grown fourfold since 2013. In KBRA’s view,
they will likely experience higher defaults and losses over the loan
term than lower levered loans secured by properties of similar
quality, regardless of location.
Exhibit 2
HL Loans on the Rise
Source: Kroll Bond Rating Agency, Inc.
As the number of HL loans has been on the rise, so has the
proportion of IG loans. As noted in the gold column in Exhibit 3,
the proportion of IG loans more than doubled from 2013 to 2014,
and is up 17% YTD 2015. These loans had in-trust KLTVs that
were generally less than 70% and averaged 57% since 2012,
which is in stark contrast to triple digit KLTV HL loans. The
proportion of UHL loans has also increased, and at a faster rate
(black column). As a result, our credit bar-bell indicator, which
sums the UHL and IG loan exposures, has been expanding at or
near two times over the past few years, and pierced 10% YTD
2015. The increase in credit bar-belling has certainly masked
overall pool-leverage, and it is an important credit consideration —
particularly where larger concentrations of UHL loans are present.
To help better discern the trends on individual deals, we have
included a listing of our rated conduit universe (2013-2015) in the
addendum of this report.
Exhibit 3
KBRA Credit Bar-Bell Indicator
Source: Kroll Bond Rating Agency, Inc.
Our review of the conduit universe indicates that credit bar-belling
has impacted the overall KLTV for the 2015 universe by more than
3% (106.0% vs 102.8%) based on a three month rolling average.
There are, however, several individual deals where the difference is
meaningfully higher, and can be as much as 10%. In one transaction,
the pool had a KLTV of 96% but if the IG loans were excluded, the
pool’s KLTV would rise to 106%.
A Closer Look at Credit Bar-Belling
“The proportion of IG loans has doubled since 2013, but
during the same period there has been an threefold
increase in High Leverage Loans with KLTVs over 110%.
In fact, loans with KLTVs in excess of 120% have grown
five times since 2013.”