


 28 / 48

CRE Finance World Autumn 2015
26
K
A Closer Look at Credit Bar-BellingPaul J. Fitzsimmons
Managing Director
Kroll Bond Ratings
Eric Thompson
Senior Managing Director
Kroll Bond Ratings
Larry Kay
Director
Kroll Bond Ratings
BRA has observed that an increasing number of
transactions have included more significant exposures
at both ends of the credit spectrum by adding more lower
leverage investment grade (IG), and highly leveraged
(HL) loans. This can result in credit bar-belling in a CMBS
deal when the low levered IG loans more than offset the impact of
higher leveraged loans in the calculations of the pool’s weighted
average KBRA Loan To Value (KLTV), KBRA Debt Service Coverage
(KDSC), and other credit metrics. Considering the increase that
we’ve seen in both IG and HL loans, we decided to take a closer
look at the issue of credit bar-belling, and its potential effect on a
transactions overall credit quality.
To explore the topic, KBRA examined each of its 101 rated conduits
to identify which of the underlying loans have credit characteristics
consistent with an investment grade rating obligation when analyzed
on a stand-alone basis. We subsequently analyzed each pool’s
credit metrics for both IG and non-IG loans, with a focus on KBRA
Loan to Value (KLTV). The results are highlighted in the
exhibitspresented herein – notably:
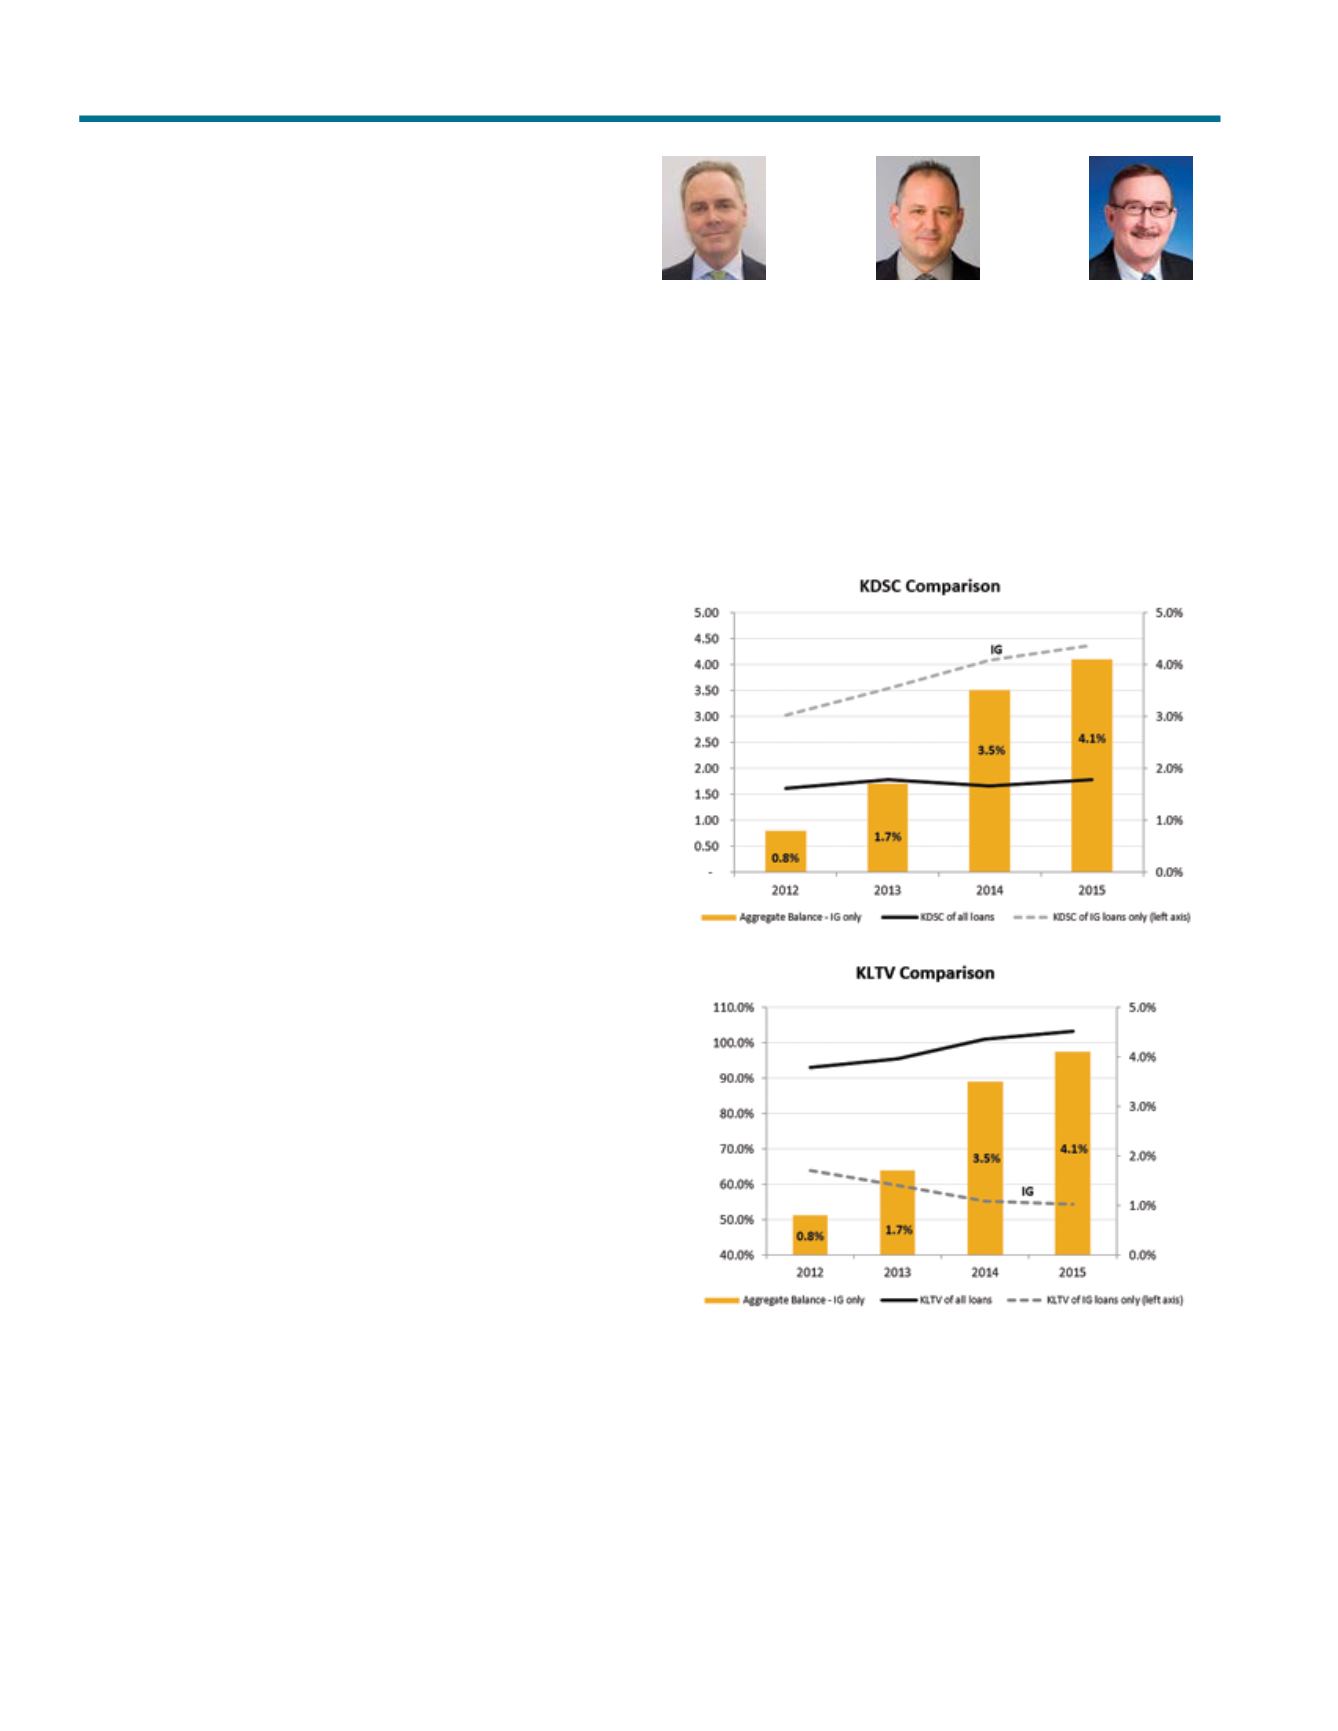
• Exhibit 1 — on a positive note, the percentage of IG loans with
favorable KDSC and KLTV credit metrics has increased over the
past three years. While the figure represents a relatively small
percentage of the conduit universe, at 4.1% YTD 2015, there
have been four transactions which had exposures to IG loans that
were in the mid to high teens since April 2015.
• Exhibit 2 — of concern is the rise in loans with high leverage “HL”,
which have KLTVs in excess of 110%. The proportion of these
loans has increased dramatically over the same time period,
and now represents more than a third of 2015 conduit issuance.
Furthermore, the presence of “ultra” HL (UHL) loans with KLTVs
in excess of 120% has tripled YTD, and currently stands at 6.1%.
• Exhibit 3 — KBRA combined the exposure to both IG and UHL
loans to create a “Credit Bar-Bell Indicator” — which has almost
doubled YTD 2015 over FY 2014, and currently stands at 10.2%.
As noted in Exhibit 1, the concentration of IG loans is increasing
and has more than doubled since 2013. Among deals with IG
loans, the exposure has ranged from 1.3% to 20.4%. In some
cases, the IG exposures are represented by whole loans, whereas
in others they are the trust component of a whole loan with
favorable credit characteristics. As illustrated in Exhibit 1, the IG
loans have KDSC and KLTV that are superior to non-IG loans.
The YTD weighted average KDSC for IG loans is 4.37x, which is
2.5 times higher than the overall average of 1.76x. The weighted
average KLTV (2012 to YTD) is 57.2% or 42% lower than the
overall KLTV of 98.9%. At these levels, IG loans should be far less
susceptible to defaults and losses than non-IG loans.
Exhibit 1
IG KDSC & KLTV
Notes:
1) IG loans are highlighted in the Key Credit Considerations section of our Presale Publications
2) KBRA’s CMBS Single Borrower & Large Loan Methodology Used in Determining IG
Classification.
Source: Kroll Bond Rating Agency, Inc.
Of rising concern is the sevenfold increase in HL loans since
2013. As the large field of originators competes for market share
in an environment with increasingly thin profit margins, they have
been more lenient on a number of fronts — particularly leverage.