


 35 / 68

 A publication of
Winter issue 2016 sponsored by
CRE Finance World Winter 2016
33
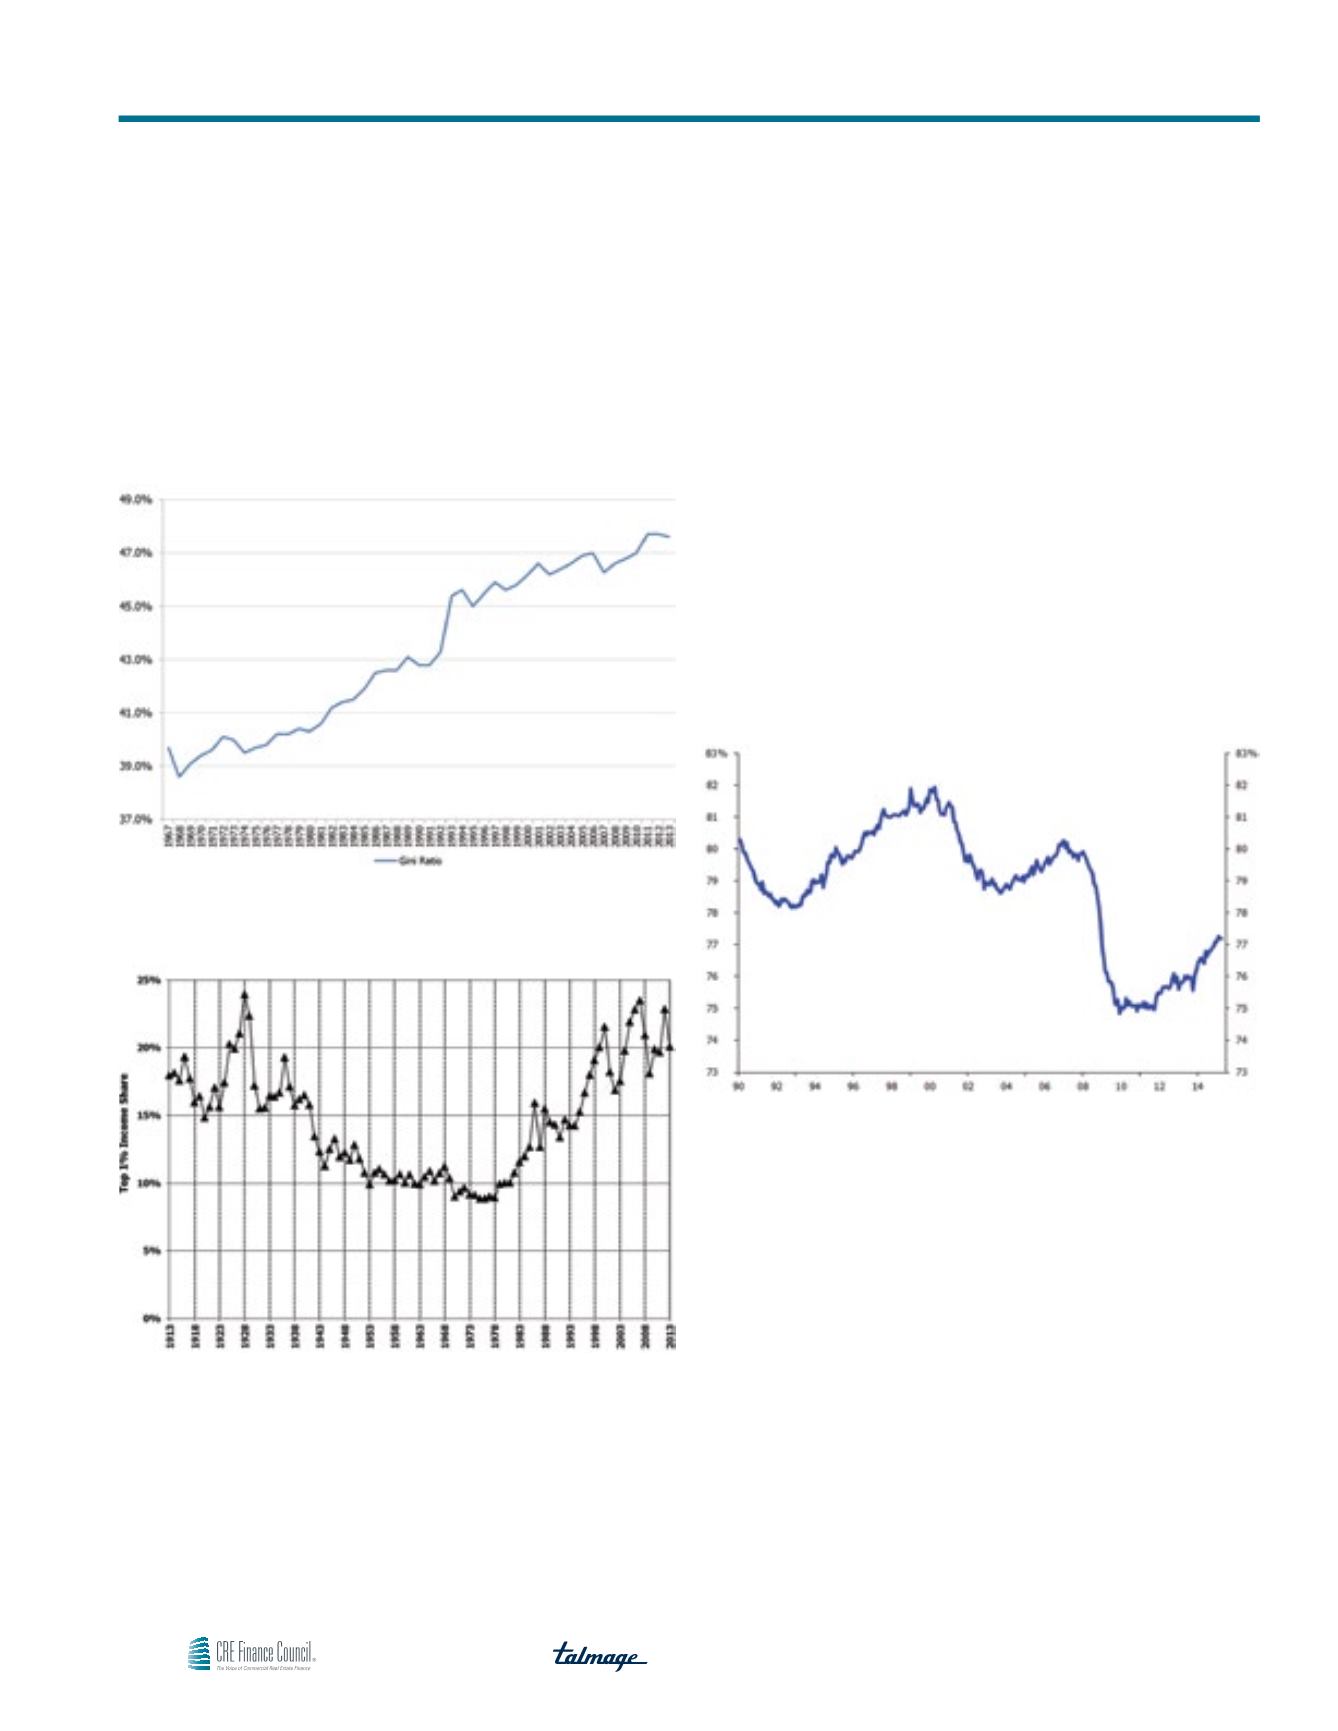
Table 11
Gini Ratio
Source: US Census Bureau.
Table 12
Top 1% US Pre-Tax Income Share, 1913–2013
Source: Piketty and Saez, 2003 updated to 2013. Series based on pre-tax cash market income
including realized capital gains and excluding government transfers.
The effect of the economic bifurcation is not limited to the 20-34
year old prime renter group; less people in all age categories can
afford homes or can qualify for mortgages
5
. Table 14 illustrates
that the employment to population ratio for those in prime working
years of 25-54 has not recovered to its pre-crisis level. According
to JCHS “the real median income for households aged 50–64 in
2012 fell to $60,300, back to mid-1990s levels. Incomes of renters
in this age group have declined especially sharply, dropping 12
percent from 2002 to 2012 and now back to 1980s levels. Real
median annual incomes have fallen by $9,100 among 50–54
year olds and by $5,700 among 55–59 year olds since 2002”.
Consequently, renting levels are up for those 55 to 64 and they
accounted for almost a quarter of the growth in renter households
between 2005 and 2013.
Table 13
Employment to Population Ratio of 25–54 Year Olds
Source: Deutsche Bank, Bureau of Labor Statistics.
Nevertheless, the prime renter age bracket of 25-34 is of more
concern. According to the JCHS study, median incomes of younger
and middle-aged adults are at their lowest levels since 1970. The
steepest declines have been among younger adults. The median
income for households’ aged 25–34 fell 11% from 2002 to 2012,
leaving their real incomes below those of same-aged households
in 1972. Some of this economic stress is manifested in the growing
share of the 25-34 year olds as well as 23-24 year olds living
in their parents’ home. In addition it has also resulted in a lower
homeownership rate.
The home ownership rate has declined precipitously from the 2005
high water mark of 69.2% reached in December 2005. The Q2
2015 homeownership rate of 63.4% is the lowest it’s been since the
63.4% achieved in March 1967 according to the U.S. Census Bureau.
Trends Impacting Habitation Alternatives