


 34 / 68

CRE Finance World Winter 2016
32
As Americans are living longer and healthier lives, the 65+ age
cohort will continue to grow. This age cohort is large both because
of the size of the baby boom generation and increased longevity.
As baby boomers age, the largest population increase will be in the
65+ age category. The number of Americans age 65+ is expected
to increase by 61% from 46 million in 2014 to 74 million by 2030.
The increase for the top 44 markets tracked by CoStar is expected
to be 63%.
Table 9
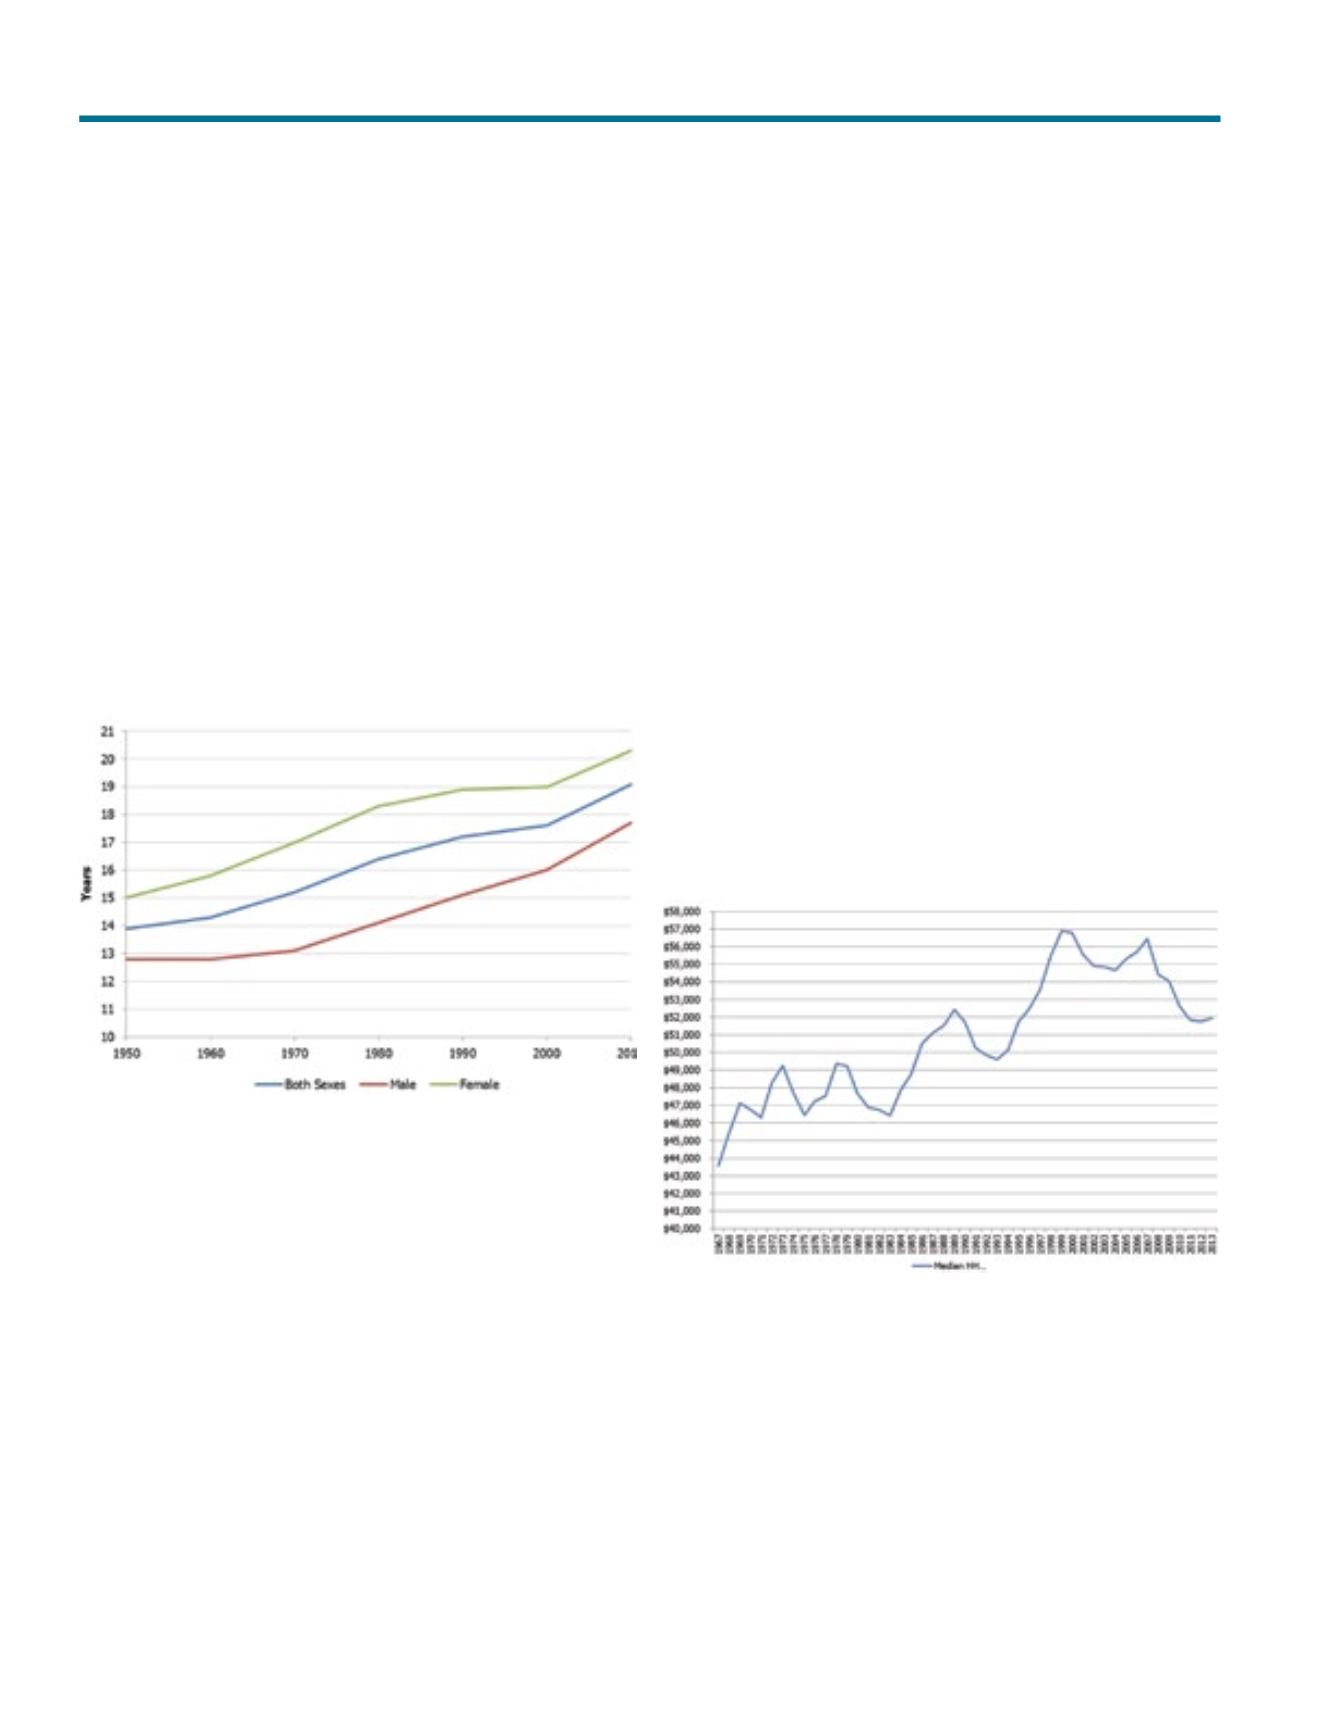
Life Expectancy at Age 65
Source: Centers for Disease Control and Prevention.
Older Americans are more likely to own a home than younger
Americans. In 2014 79.9% of adults 65+ owned a home compared
to 76.3% of those 55 to 64 years, 70.7% of those 45 to 54 years,
and 59.7% of those 35 to 44 years. Home ownership rates taper
off after age 75. Even though individuals in the 65+ age bracket
are less likely to rent apartments, the significant growth of this age
segment will add substantial numbers to the potential rental pool.
Even if the current share of seniors that downsize from owning
to renting remains steady – the large size of the age cohort will
increase demand for multifamily units. Future seniors are less likely
to own homes as evidenced by the current home ownership rate of
the 55-64 and 45-54 age categories. Indeed renting levels have
increased over the past 10 years for those 45 to 64 according to
the recent JCHS study.
Economic Stress Being Experienced by Large Sectors of
American Society
Although the economy has improved significantly, since the great
recession, a considerable sector of American society has been
left behind. Despite significant improvements in the unemployment
rate (U-3) to pre-crisis levels, and a lower rate of the more expansive
U-6 measure of unemployment, the employment to population
ratio remains significantly below prerecession levels. The
employment to population ratio for those aged 25-64 is 73.5%
vs. 76.5% prerecession.
The recovery economy is tarnished by weak wage growth and
a record number of civilians not in the labor force. Real median
household income in the United States has declined since its
most recent peak in 2007. Although median household income
experienced a slight increase in 2013, it has not recovered back
to the level achieved in 1996.
Table 10
Real Median Household Income 1967–2013
Source: US Census Bureau.
Since the financial crisis 86% of Americans have seen their wages
fall in real terms, while 14% have experienced a real wage rise
4
.
Measures of income inequality include the Gini Ratio and the
distribution of income and wealth between the top 1% and the
bottom 99%. Tables 12 and 13 illustrate that the Gini Ratio is
near a 50 year high and lopsided income distribution is near a
90 year high.
Trends Impacting Habitation Alternatives
“Longevity has resulted in
more adult years without
children at home.”