


 32 / 68

CRE Finance World Winter 2016
30
Economic Stress of Millennials
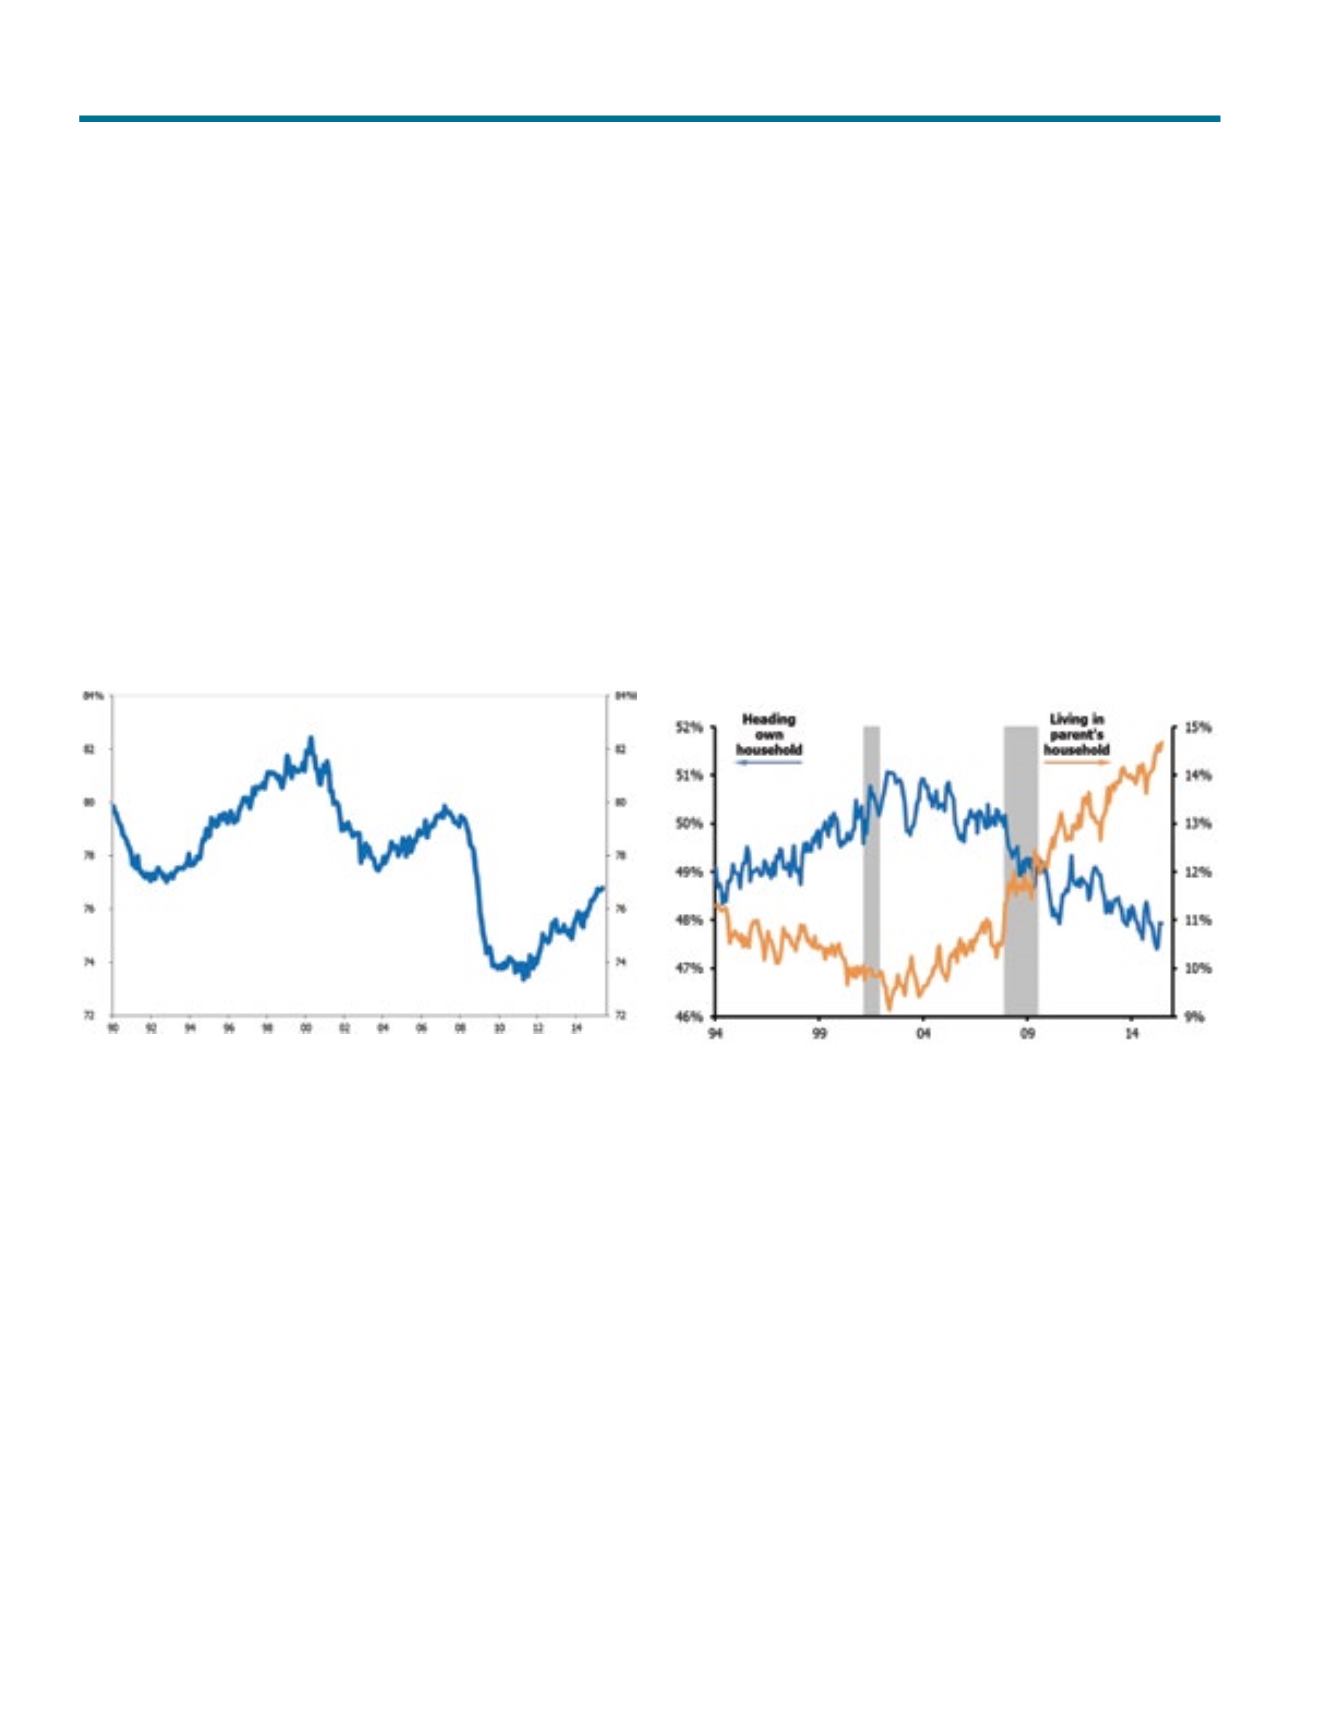
The employment to population ratio for the 25-34 age cohort stands
at 76.8%. This is an improvement over the low point of 73.4%
reached in April 2011, but not recovered back to its prerecession
peak of 79.8% and certainly not back to the 82.4% achieved in
April 2000. The employment to population ratio is lower among the
25-34 age bracket than it is for the 25-54 age bracket.
Table 4
Employment-to-population Ratio, Ages 25-34
Source: Deutsche Bank, Bureau of Labor Statistics.
Other signs of stress include the burden of student loans. According
to a recent Joint Center for Housing Studies of Harvard University
(JCHS) report, 39% of households headed by individuals aged 25-
34 had student loans in 2010 up from 26% in 2001 and more than
double the level in 1989. The median amount of that debt rose
from $10,000 to $15,000 in real terms between 2001 and 2010.
Within this group, the share with at least $50,000 in student debt
more than tripled from 5% to 16% during the same time period.
More individuals in this age group are living in their parent’s
household. Approximately 14.6% of the 25-34 year-old demographic
were living in their parent’s household as of April 2015 and 47.3%
were heading their own household. The balance (37.9%) constituted
the spouses or roommates of household heads. The parent
household dweller share is at a 21 year high and is the result of
coming of age during the recent recession and the economic
stress of certain segments of American society. Nevertheless, it
also indicates potential pent up demand. As the economy improves
many of these individuals will move out of their parent’s homes and
in to rental units. Even a small improvement will have a significant
impact on rental demand growth in this large age cohort.
Table 5
Living Arrangements of 25-34 Year-olds
Source: Bureau of Labor Statistics, J.P. Morgan.
The Growing Prevalence of Singlehood
Single or Non-Family Households Are the Majority
Married individuals (married family households) head 48.4% of all
households while single individuals (single or non-family households)
head 51.6%. This is a significant reversal from previous decades
when the respective numbers
for married family households
and single or non-family
households where as follows;
2000: 52.8%, 47.2%, 1990:
56%, 44%, and 1980: 60.9%,
39.1%. In 1950 single or
non-family households constituted only 21.8% of all households.
About 50.2 percent or 124.6 million American adults are single
compared to 22 percent in 1950
2
.
Trends Impacting Habitation Alternatives
“Single or non-family
households are
the majority.”