


 43 / 72

 A publication of
Summer issue 2015 sponsored by
A publication of
Summer issue 2015 sponsored by
CRE Finance World Summer 2015
41
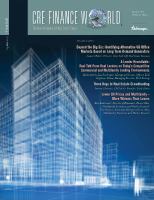
Exhibit 3
US CMBS: Annual Revenues and Expenses per Unit for SH/NonSH
DBRS sampled all multifamily properties securitized in CMBS deals of
all vintages and based on borrower reported financials (rather than
servicer normalized), found that the expense ratio between student
housing (44.2%) and non-student housing properties (45.2%) are
essentially the same. The overall operating expense on a per unit
basis was found to be $5,808 and $4,881 for student housing and
non-student housing properties, respectively. Looking at income,
annual revenue per unit was also found to be higher for student
housing properties ($10,045) versus non-student housing properties
($9,443). The data does suggest, however, that reported replacement
costs were are on average 20.6% higher for student housing
properties ($268.25 per unit) than non-student housing properties
($222.47 per unit). While there are some in the market, including
DBRS, which underwrite above-average capital expenditures on
properties with student concentrations in order to reflect this trend,
it is not a method employed universally among lenders.
Exhibit 4
US CMBS: CapEX & Expense Ratio for SH/NonSH
In legacy CMBS (transactions issued prior to 2010) student housing
properties have roughly the same probability of loss (10.3%) when
compared to non-student housing multifamily properties (11.1%);
they have a similar albeit slightly higher loss severity (53% vs.
49%) . However, there is reason to suspect that CMBS 2,0 student
housing is different than the legacy student housing and that its
performance will be different than non-student housing multifamily
going forward. As noted in the graph below, the watchlist rate for
student housing properties securitized in transactions issued in
2010 through present day is significantly higher than the watchlist
rate for non-student housing multifamily properties.
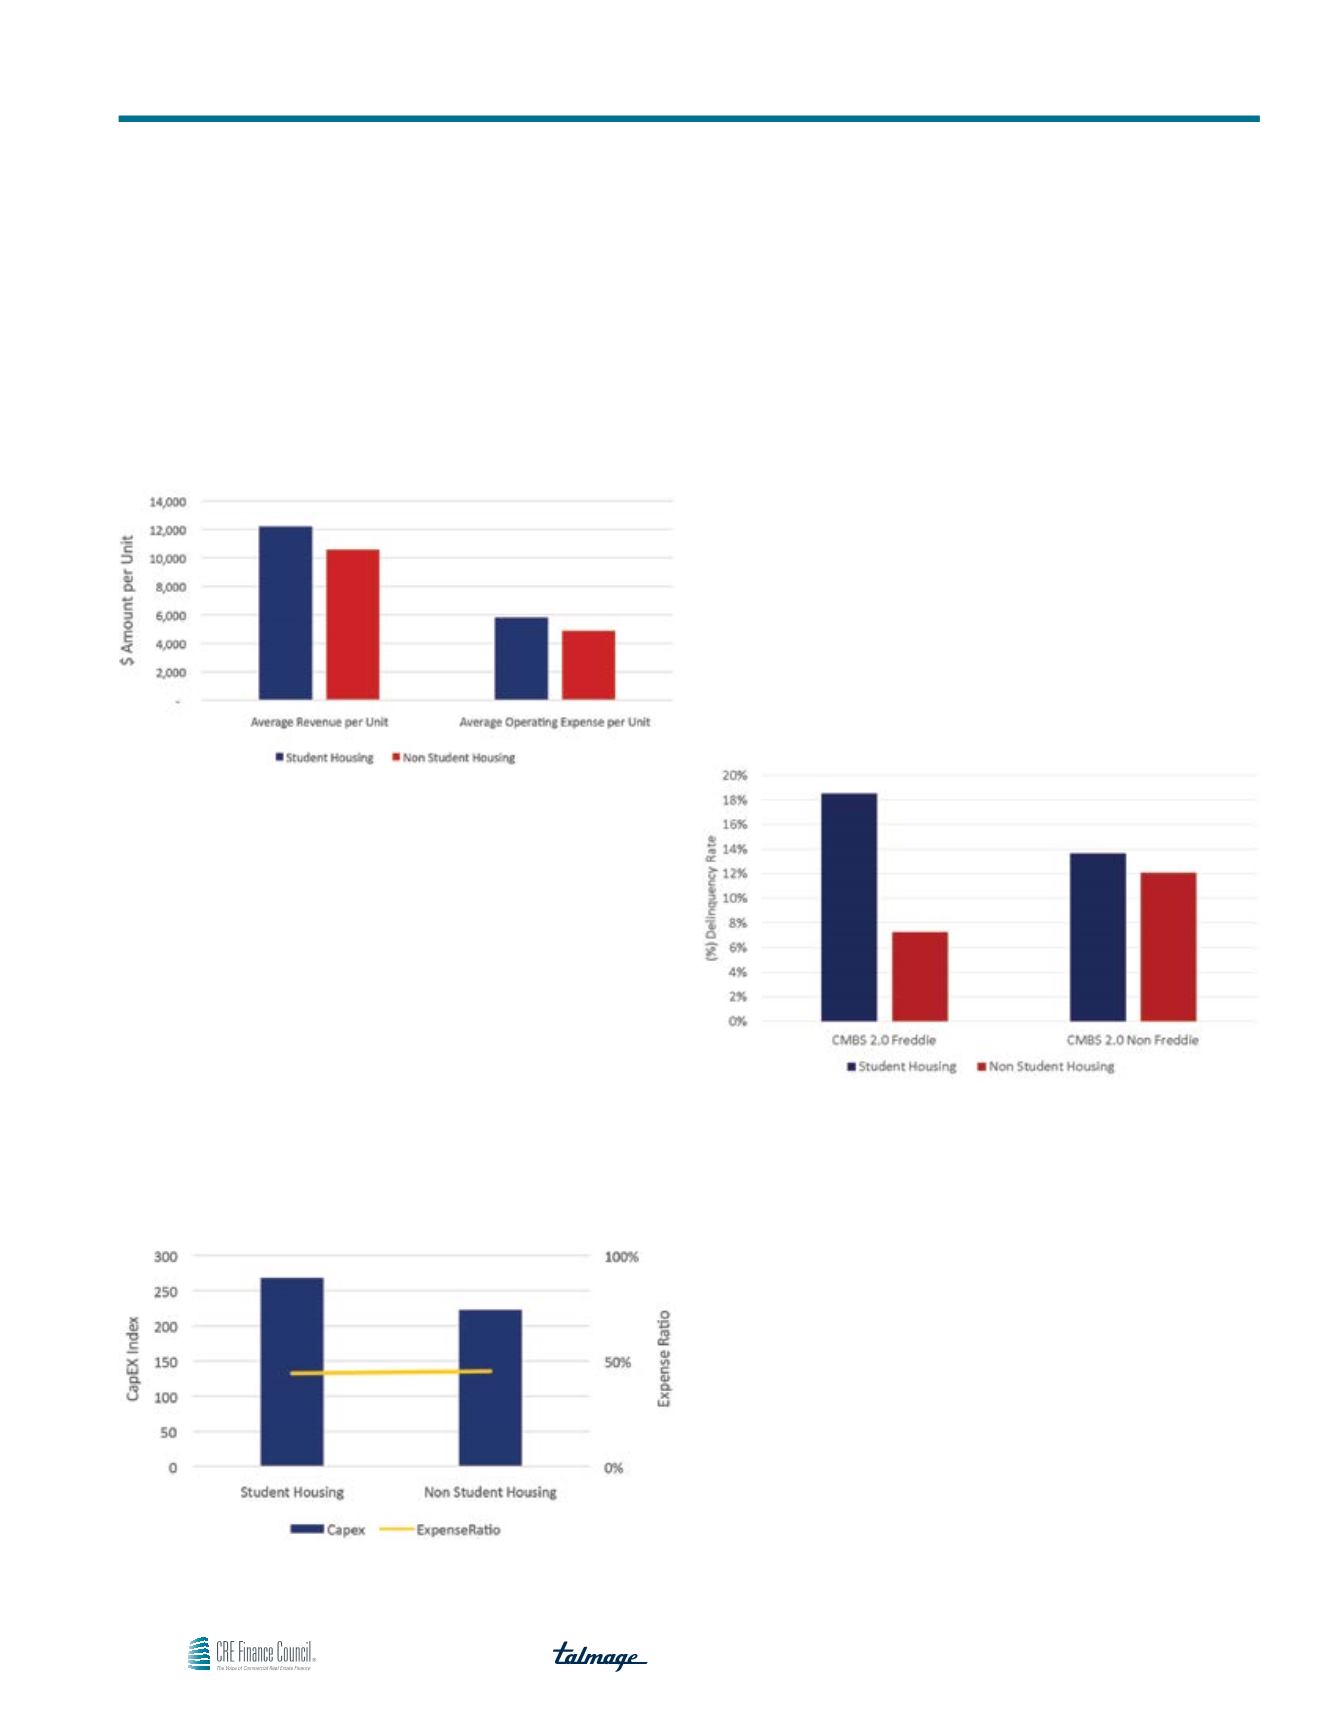
Exhibit 5
US CMBS: Student Housing Watchlist Rate Since 2010
Breaking out those transactions issued by Freddie Mac, the trend
continues, which is interesting given the agency’s well-defined
lending guidelines. In the CMBS industry, it is widely believed that
Freddie Mac, and its GSE sister, Fannie Mae, is offered the first
look to lend on multifamily properties because of its attractive cost
of capital and therefore can be selective in its lending practices.
The elevated watchlist rate of even Freddie Mac loans secured by
student housing properties versus non-student housing multifamily
Freddie Mac loans further perpetuates the perception of increased
volatility associated with these assets.
Student Housing Performance in CMBS