


 11 / 48

 A publication of
Autumn issue 2015 sponsored by
A publication of
Autumn issue 2015 sponsored by
CRE Finance World Autumn 2015
9
T
Countdown to 2017 — The Great Wall of Maturitieshe great “wall” of maturing commercial mortgage backed
securities (CMBS) loans has received so much attention
that it almost seems like a mythical creature. The sheer
volume of maturing loans is one reason for the attention.
In 2015, 2016 and 2017 alone there are more than $350
billion of CMBS loans maturing. Another reason these maturities
have everyone’s attention is because a significant portion of these
loans are not predicted to be able to be paid off by their due dates.
In 2013, there was speculation that this great wall of approximately
$350 billion of CMBS maturities would surely wreak havoc on
the whole commercial real estate industry. In the opinion of many
experts that year, approximately half of this $350 billion would not
be able to be refinanced. The main reasons for the refinancing
concern stemmed from the sheer volume of loans needing to be
refinanced, as well as the aggressive underwriting standards that
were utilized during the origination years of these 10 year loans —
2005, 2006, and 2007.
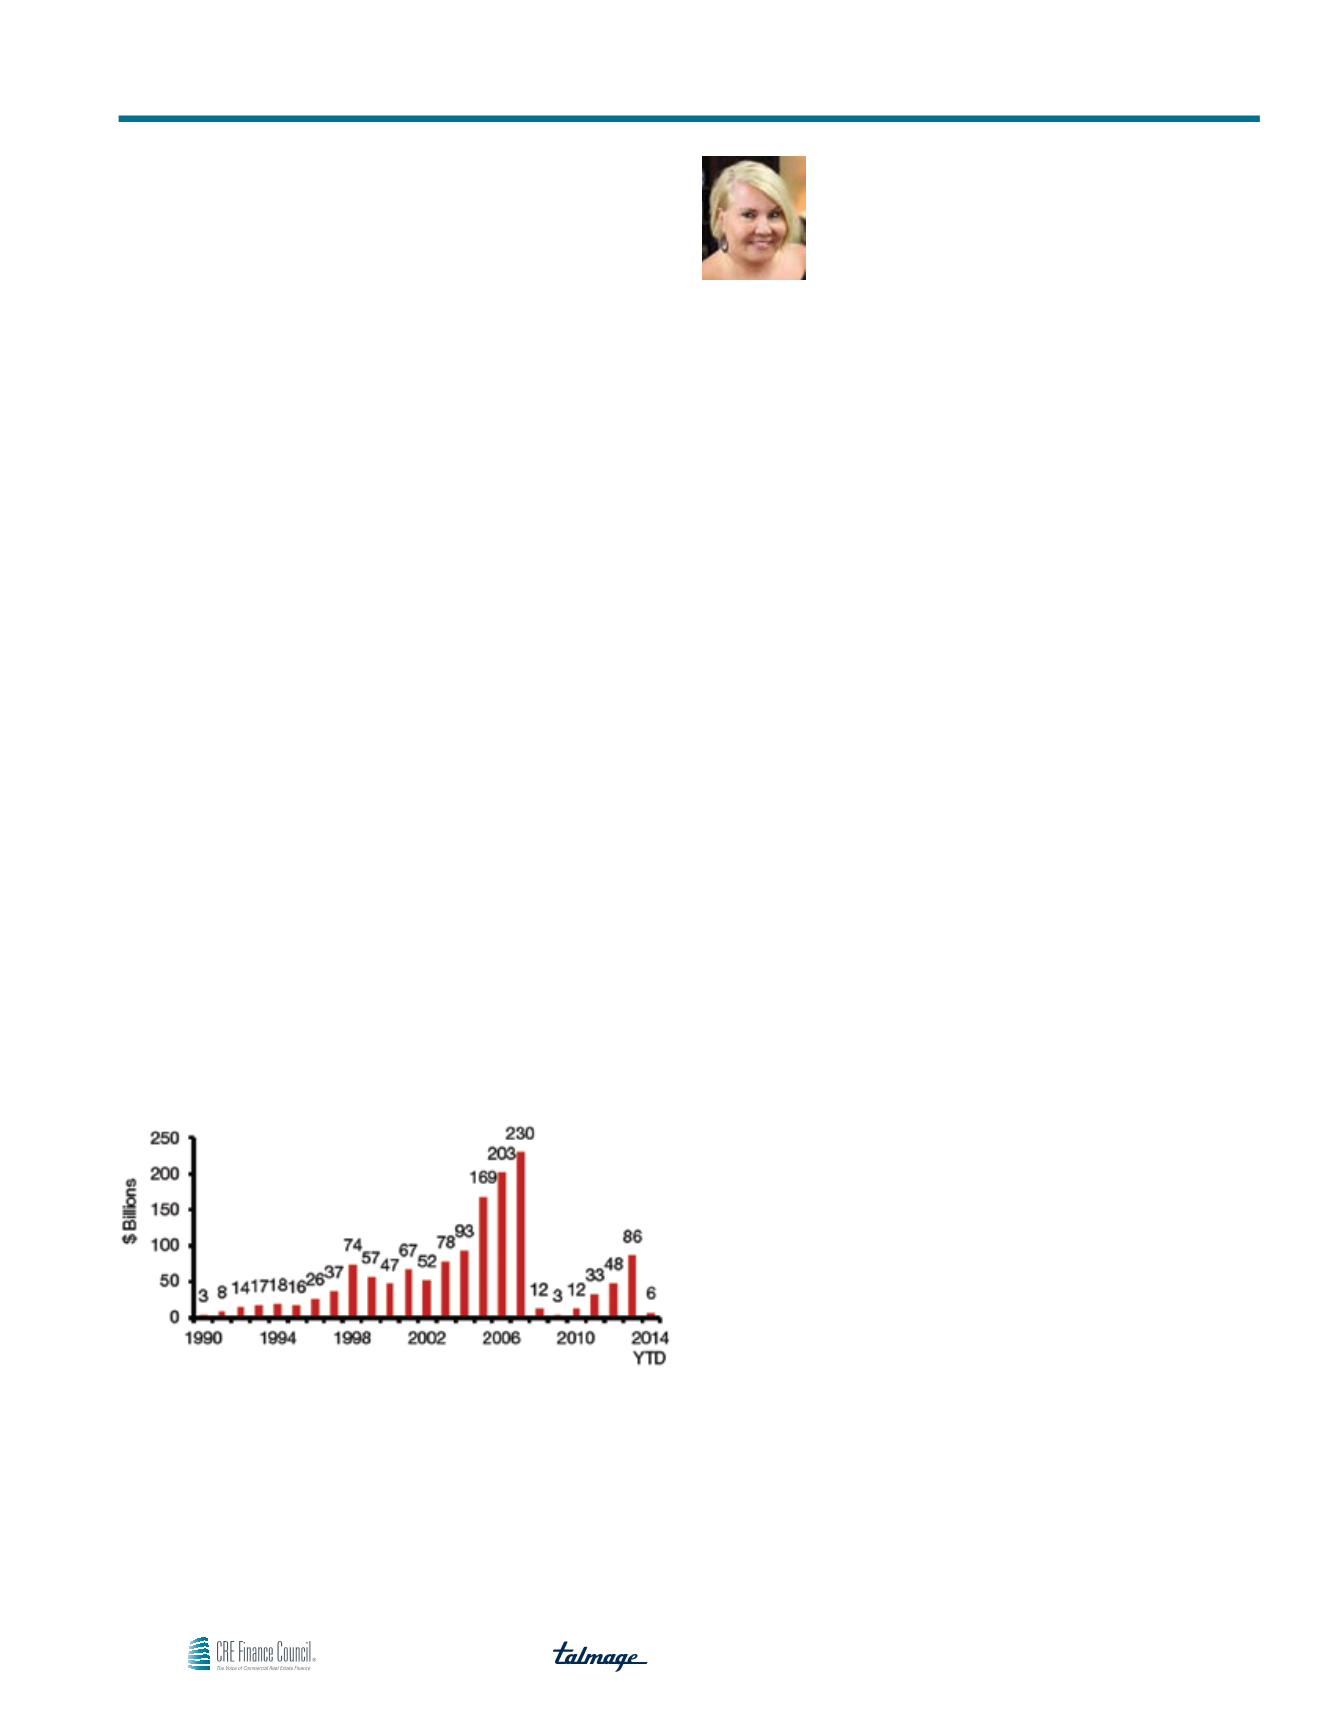
Annual CMBS issuance during the years 2005, 2006 and 2007
was off the charts from a historical perspective, totaling over $600
billion. The volume of CMBS loans originated during those three
years was about two times the average volume of CMBS loans
originated today. So, even if these maturing loans had no other
“issues,” there is still a shortfall in the funding available for this
huge volume.
Figure 1
Annual Historical U.S. CMBS Issuance
Source: Commercial Mortgage Alert
As the volume of CMBS issuance increased year over year in 2005,
2006 and 2007, the competition between originators became fierce.
To stay competitive in those years, it became standard to provide
high leverage loans that did not require amortization over the loan
term with minimal reserve requirements. Rental rates were also at
an all-time high. This combination of characteristics might be okay
if real estate prices had only increased during the last 10 years.
By year-end (YE) 2014, there was enough financial information
available for each property to get a better assessment of the
size of this mythical creature called the Great Wall of CMBS
maturities. Using YE 2014 Net Operating Income (NOI) numbers
supplied by owners, the various market constituents (including
the rating agencies) published estimated LTVs for the maturing
loans. To determine the value of the properties, these reporting
sources typically applied a market cap rate to the YE 2014 NOI to
determine the value of the property and then divided the value by
the loan balance to get the LTV.
Although there are various sources of this information and many an
article has been written on the subject, the general consensus by
late 2014 for the percentage of maturing loans anticipated at 80
percent or greater LTV at maturity date was 30 percent. The good
news is that it seemed less disastrous than the original prediction
of 50 percent! Contributing to the higher rate of loans predicted to
pay off at maturity was the all-time low interest rate environment.
By early 2015, the commercial real estate industry began celebrating
because it seemed that this large mythical creature would not
devour us after all. It would only devour 30 percent of us. So,
whether you are celebrating or not as a commercial real estate
owner is completely dependent on whether you are personally in
the 70 percent category of owners who can pay off their loan at
maturity — or the 30 percent who can’t pay off their loan at maturity.
Now that we are more than half way through 2015, let’s take a look
at reality.
According to the CMBS Surveillance Maturity Report for July
2015 published by Morningstar *: as of June 30, 2015, the total
remaining amount of loans still to mature in 2015, 2016 and
2017 is now just below $250 billion – approximately $24 billion
remaining in 2015, approximately $110 billion in 2016 and $112
billion in 2017. Here are the stratifications by LTV per year of those
maturing loans:
Ann Hambly
Founder and CEO
1st Service Solutions