


 60 / 72

CRE Finance World Summer 2015
58
he Trepp/CREFC Portfolio Lenders Survey for the U.S.
insurance company sector was launched in 2011 to
collect investment performance and trend-line data on
commercial mortgages held by life companies. Trepp
updates the format of the survey to keep the content
current and make it more meaningful to the participating firms.
Twenty-one insurance companies participated in the most recent
survey, which covered the first half of 2014. With $160 billion in
combined commercial mortgage assets, the participants represented
nearly half of the industry’s total mortgage exposure.
Survey participants submit data from their General Account on a
semi-annual basis. The companies also submit data from subsidiaries
in order to fully capture the performance of any sub-performing
or non-performing loans in these entities. Trepp then analyzes the
data and publishes detailed results.
Each participating firm receives a report containing a detailed analysis
of all the survey responses. The firm’s results are benchmarked
against its peer group, which is based on the CRE portfolio asset
size and industry data. Peer group categories are defined as: large
firms with assets > $10 billion, medium firms with assets of $5
-$10 billion, and small firms with assets < $5 billion.
Participating firms use the survey results for general benchmarking
purposes as well as for relative performance measurement. The
survey results enable the insurance companies to assess the
investment performance of portfolio lenders and limit the need
for severe stress testing by rating agencies and other parties.
Trepp will present the results of the latest iteration of the survey
at the June CREFC Conference in New York during the Portfolio
Lenders Forum Session on Monday, June 8.
Key Mid-Year 2014 Highlights:
Stable Mortgage Portfolio Allocations
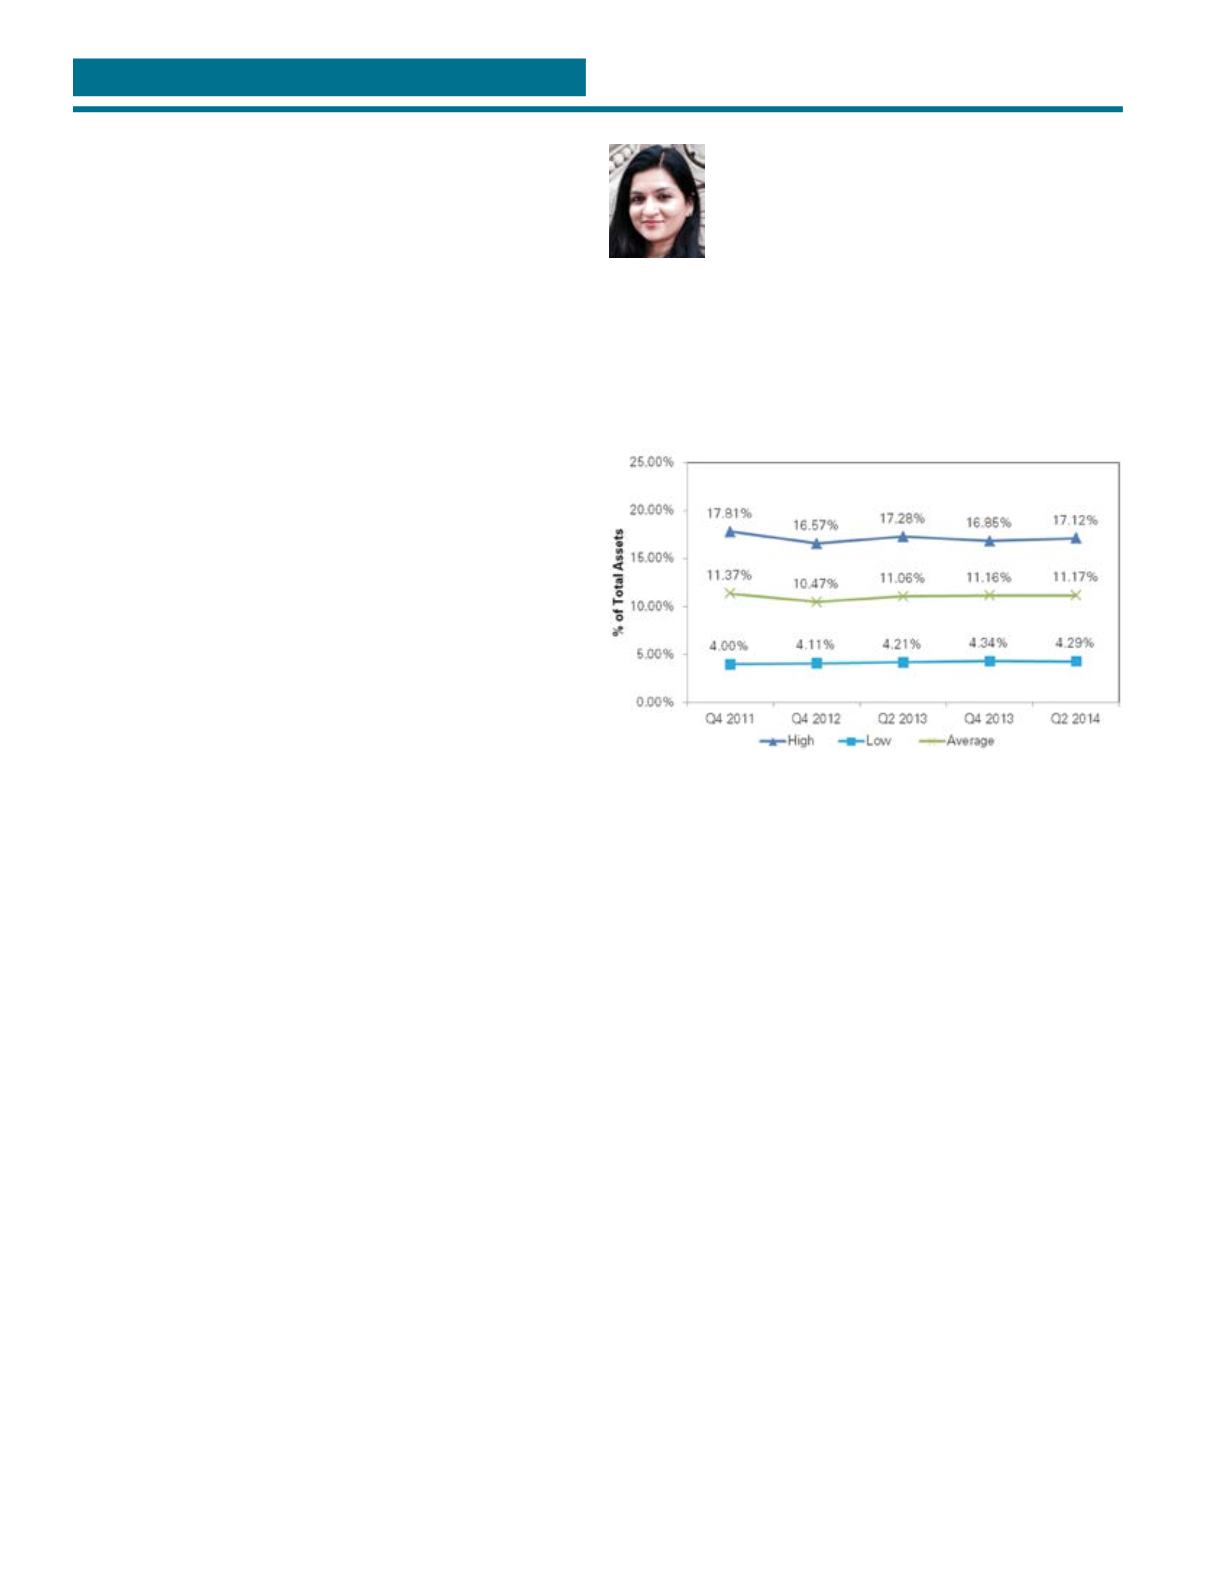
The First Half 2014 Portfolio Lenders survey showed stability in
mortgage investments. Mortgage holdings represented an average
of 11.17% of survey participants’ total invested assets during the
first half of 2014. This average was little changed from the year-end
2013 average of 11.16%, and was up only slightly compared to the
mid-year 2013 average of 11.06%. Mortgage holdings among the
participants ranged from 4.29% to 17.12%. Large firms continue
to dedicate greater allocations to commercial mortgages, in the
11%-17% range.
Exhibit 1
Mortgage Activity, % of Total Invested Assets
As of Q2 2014, six life companies boosted their mortgage portfolio
allocation by more than 1%, with two making changes of greater
than 6% and one over 15%.
Continued Superior Performance
Life insurers experienced their fourth consecutive year of strong
mortgage performance. Total realized net losses were 0.04% as
of mid-year 2014, a decrease of six basis points from the 0.10%
net losses reported in 2013. Life insurers compared favorably
to the other two lending markets, CMBS and commercial banks,
whose recorded losses measured 0.84% and 0.09%, respectively.
Even as CMBS and commercial banks posted sizeable improvements
from 2013, insurance firms still managed to outperform the
other markets.
Compared to year-end 2013, reported problem loans (which
includes loans currently 90+ days delinquent) increased by four
basis points to 0.10% as of mid-year 2014. However, delinquency
rates for insurance firms stayed well below CMBS (5.86%) and
commercial banks (1.80%).
T
Portfolio Lenders Survey:
U.S. Life Insurers’
Mortgage Outlook
Sonal Paradkar
Assistant Vice President
Trepp
FORUM SPOTLIGHT