


 36 / 48

CRE Finance World Autumn 2015
34
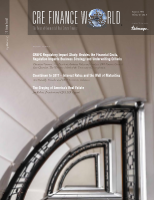
Chart 1
U.S. Average Daily Trading Volume Of Munis, Corporates, And Agency MBS
2002-2015 YTD
Year
Treasuries
Agency
MBS
Corporate
(IG Only)
Municipal
2002
366.4
154.5
12.7
10.7
2003
433.5
206.0
11.9
12.6
2004
499.0
207.4
11.2
14.8
2005
554.5
251.8
10.2
16.9
2006
524.7
254.6
10.4
23.1
2007
570.2
320.1
10.2
25.1
2008
553.1
344.9
9.2
19.4
2009
407.9
299.9
13.3
12.5
2010
528.2
320.6
12.9
13.3
2011
567.8
243.3
13.2
11.3
2012
518.9
280.4
13.9
11.3
2013
545.4
222.8
14.9
11.2
2014
505.4
177.9
15.4
9.9
2015 YTD
500.6
203.2
16.7
9.8
Source: FINRA Trace/IDC via SIFMA, 2015 data Through July 31.
Data in $billons
Chart 1 shows that agency MBS is the most liquid bond product
traded in the U.S. by a wide margin, except for Treasuries. This
explains investors’ concerns that it is classified as level 2A and
haircut at 15%. While bid-asked spreads for corporate and
municipal bonds are also consistently quoted by many market
makers, the volumes are nowhere near the magnitude that can
be traded in the agency market.
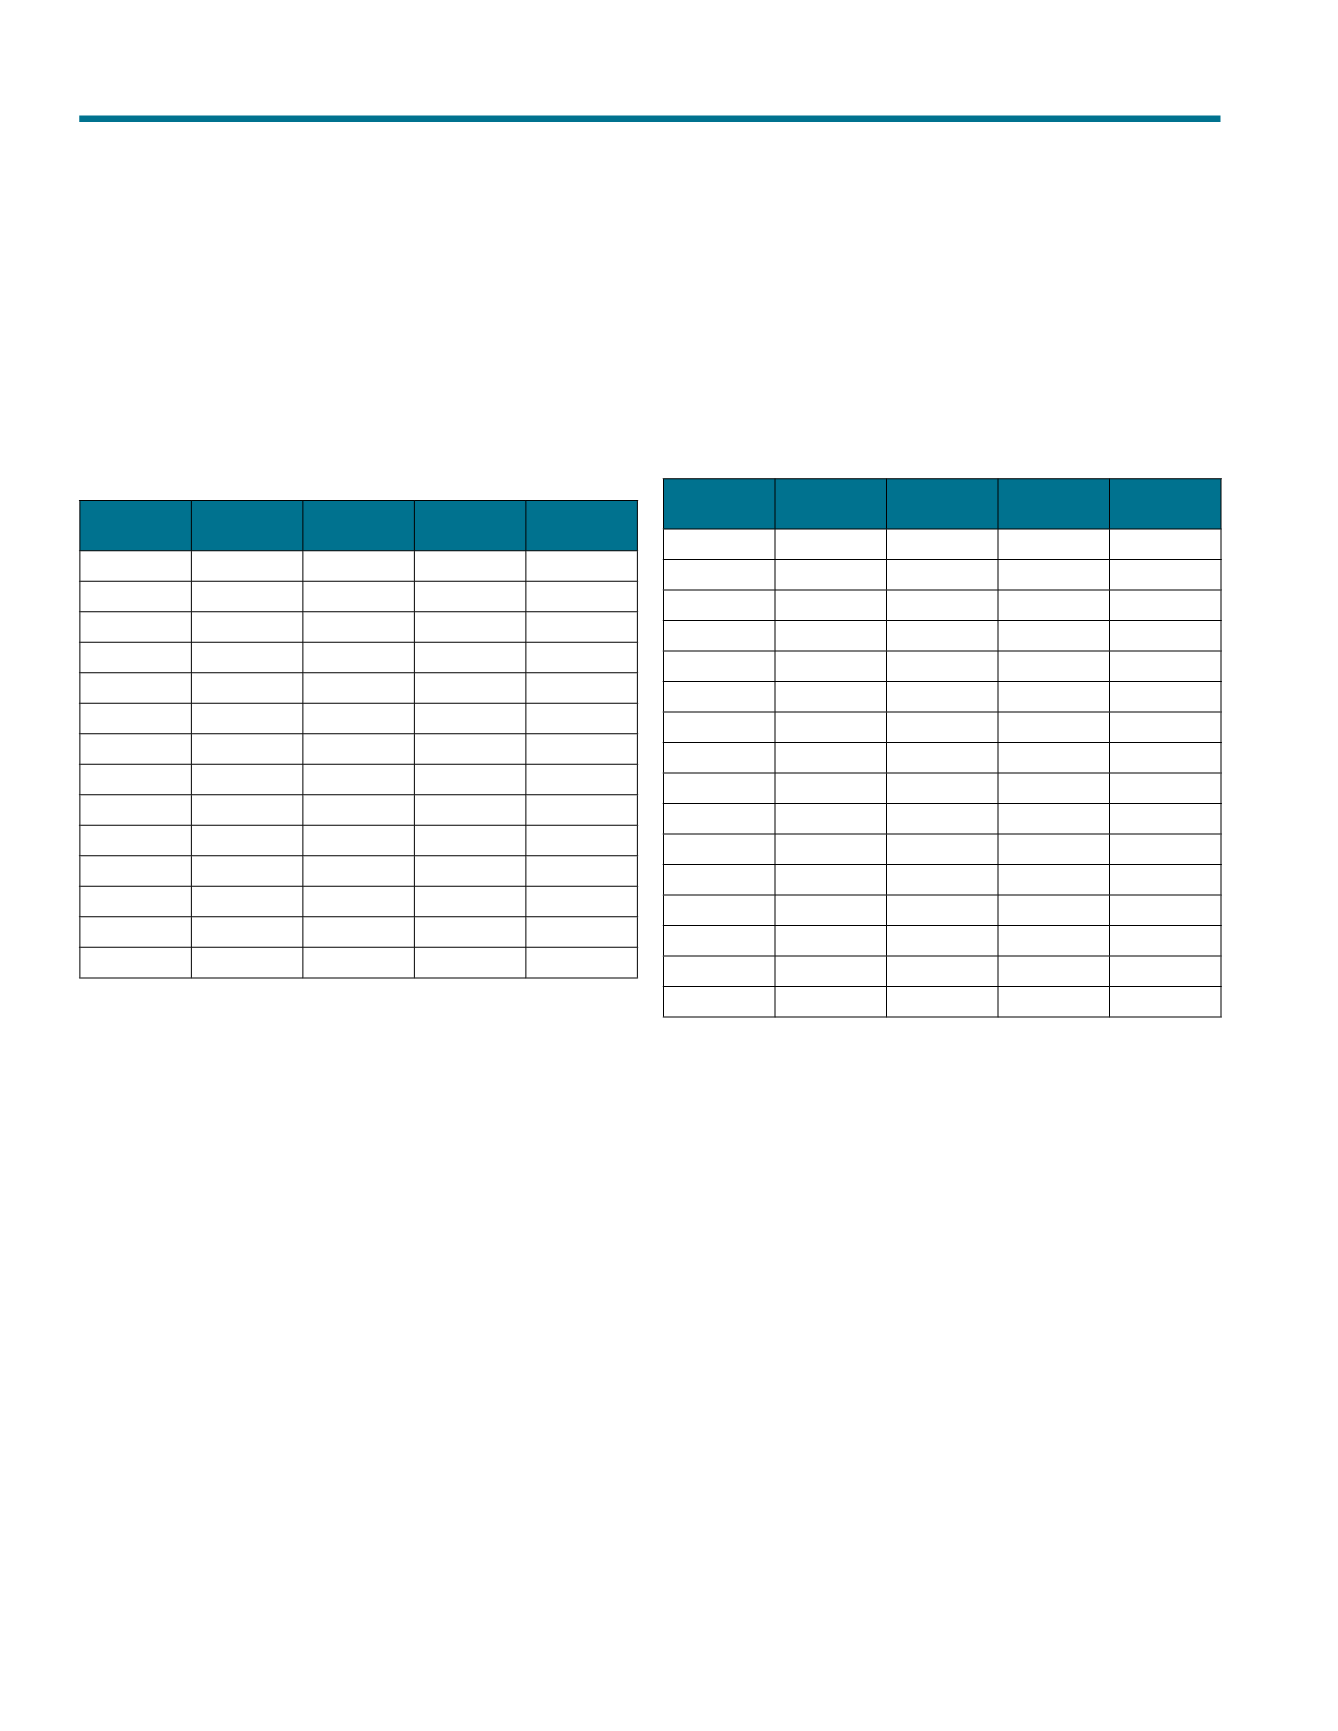
Chart 2
U.S. Average Structured Finance Daily Trading Volumes Q3 2011-Q1 2015
CMBS
(P&I Only)
Auto
Credit Card
Student
Loan
2011 Q3
1425.0
136.3
273.1
217.7
2011 Q4
967.9
165.7
176.8
168.2
2012 Q1
1511.9
236.4
249.6
280.8
2012 Q2
1312.4
295.2
250.6
344.7
2012 Q3
1367.1
290.7
190.8
302.7
2012 Q4
1319.5
558.8
340.2
367.7
2013 Q1
1522.5
711.4
305.2
422.5
2013 Q2
1548.5
664.1
280.5
392.3
2013 Q3
1535.4
622.2
403.5
195.1
2013 Q4
1167.4
530.8
398.6
191.1
2014 Q1
1280.7
788.8
461.2
347.6
2014 Q2
1271.6
792.4
402.0
293.0
2014 Q3
1070.5
785.4
589.7
355.4
2014 Q4
1020.5
746.0
522.3
223.4
2015 Q1
1070.9
851.9
447.1
263.2
2015 Q2
1199.4
Source: FINRA Trace/IDC via SIFMA
Data in $millions
Because of the limited overall liquidity during the 2008-2009
crisis, many investors turned to other securitized bonds products
such as CMBS, as many market makers were still able to transact
among accounts in large amounts in these products, albeit at wider
spreads. For CMBS, this created a record of widening historical
price transaction levels, but given the volumes involved, that record
actually indicates that liquidity was available in a functioning
marketplace. Looking at the available data since 2011 (see chart
2), CMBS clearly remains one of the more actively traded and
liquid structured finance bond sectors, with average trade volumes
usually exceeding $1 billion on a daily basis. The shorter duration
ABS products, such as credit cards or autos, have very low trading
volumes because those investors usually buy to hold for the two-
or three-year term, and so market makers may be less prepared
to make markets in those bond classes. As a result, and because
of their shorter terms, these bonds are less likely to see price
distortion. The question still exists as to whether these assets are
as liquid as a super-senior CMBS class that did see bids during
crisis conditions. The overall high trade volumes for CMBS are
likely to come mostly from the highest-rated classes, as many
investors use those classes as a swap spread or yield substitute,
Basel III’s Recent Liquidity Guidelines